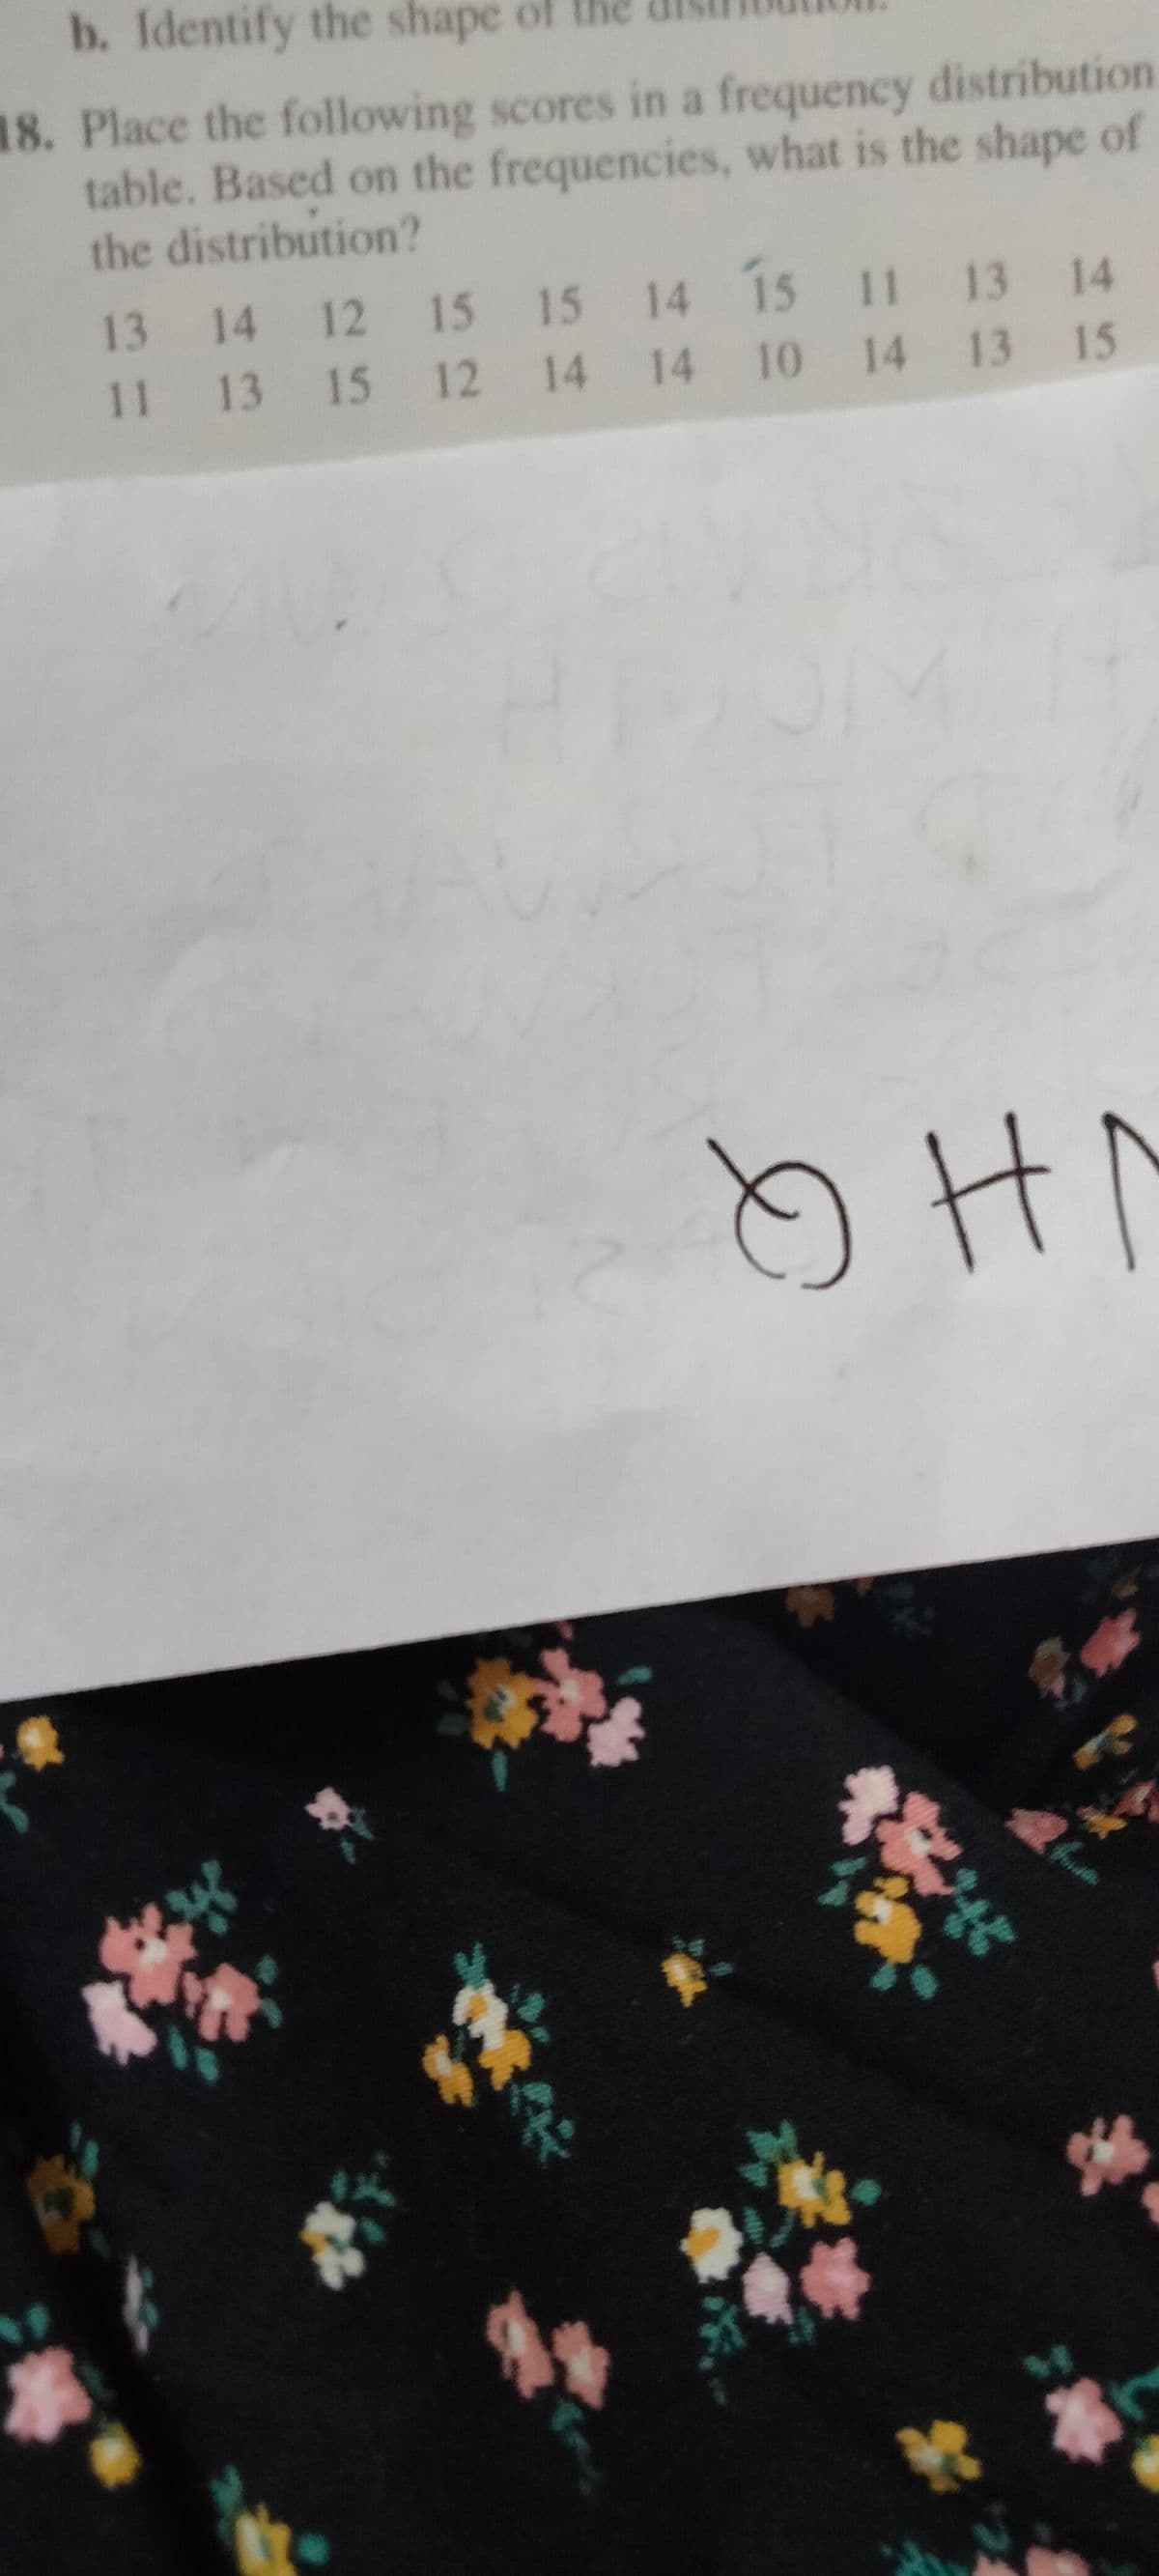
- Place the following scores in a frequency distribution table. Based on the frequencies, what is the shape of the distribution? 13 14 12 15 15 14 15 11 13 14 11 13 15 12 14 14 10 14 13 15
Q: For the following grouped frequency distribution table of exam scores, how many students had scores…
A: Given data, How many students scored higher than X=54?
Q: The following data represents the ages of 30 students in a statist class. Construct a frequency…
A: Class width:
Q: Practice Task • A final examination given to 47 students resulted to the following grades 26 82 82…
A: Range is a measure of dispersion and is calculated as the difference between the highest and lowest…
Q: Find the mean, median, and mode for the frequency distribution of score of 56 students in Statistics…
A:
Q: Calculate the median for the following data, which represents the time taken to go to work for fifty…
A: Given that Table for time taken to work for 50 people. Time spent Repetition Less than c.f.…
Q: Construct a frequency distribution table for the following set of scores. Scores: 3, 2, 3, 2, 4,…
A: The scores are: 3, 2, 3, 2, 4, 1, 3, 3, 5
Q: CLASS 6-10 11-15 16-20 21-25 26-30 TOTAL FREQUENCY 7 18 20 17 8 70
A: Given Total frequency 70
Q: Q1 Nixon Corporation manufactures computer monitors. The following data are the numbers of computer…
A: Given data:…
Q: A. The following scores represent the final examination grades for an elementary statistics course:…
A: *answer:
Q: Find the median for the scores in the following frequency distribution table:
A:
Q: 2. Complete the frequency distribution table, then find the mean, median, and mode of the scores…
A:
Q: 1. Construct the frequency distribution corresponding to the ogive curve given below. 100 90 80 70…
A: We want to construct Frequency distribution corresponding to the ogive curve
Q: You are given the following frequency distribution. Class Frequency 10 – 19 12 - 20 – 29 19 30 – 39…
A: We have given that, The frequency distribution is, Class frequency 10-19…
Q: 12. What is the median for the population of scores shown in the frequency distribution table? f 1 3…
A:
Q: Use the following raw scores to answer the questions below. 29 21 19 29 20 28…
A: Please note that as per our guidelines if the question is a subparts question we can answer the…
Q: Draw a polygram for the distribution of scores shown below x f 6 2 5 5 4 3 3…
A:
Q: 1. Place the following set of n = 20 scores in a frequency distribution table. 2 2 1 3 1 6 2 4 7 1 2…
A:
Q: Construct a frequency distribution table for the fol- lowing set of scores. Include columns for…
A: Introduction: The frequency distribution for the given scores is to be constructed.
Q: The data represent the ages of Presidents at the time they were first inaugurated. 57 61 57 57 58 57…
A: “Since you have posted a question with multiple sub-parts, we will solve the first three sub-parts…
Q: 4. For the following data, construct a grouped frequency distribution table. Include columns for…
A: Steps to obtain the frequency distribution: The lowest value in the data set is 6. The highest value…
Q: Use the following data (exam scores) from pre-calculus class to construct a frequency and percentage…
A: From the above data We are given that the observations. 33 42 49 49 53 55 55 61 63 67 68 68 69 69…
Q: a. Construct a frequency distribution and a percentage distribution. b. Construct a cumulative…
A: a. The frequency of each class is obtained by counting the number of times each data point appeared…
Q: Based on the following frequency distribution, what would you conclude is the shape of the…
A: In the given frequency distribution the frequencies are decreasing with each of the classes. It…
Q: Calculate the 20th percentile of the data set shown 5.5 7.5 14 14.5 15.8 18 19.3 23.7 24.3 26.1
A: Given information: 5.5, 7.5, 14, 14.5, 15.8, 18, 19.3, 23.7, 24.3, 26.1
Q: Calculate the median of a distribution with the following histogram: 9. 11.5 20.5 29.5 38.5 Class…
A: Median is the value which divides the data into two equal parts. The frequency of a class in grouped…
Q: Draw both a Histogram and a Frequency Polygon to illustrate the following distribution of IQ scores:…
A: Given Information:
Q: Consider the following frequency distribution. Class Midpoint Frequency 0 - 9 4.5 2 10 – 19 14.5 8.…
A:
Q: Find the arithmetic mean and median
A: Since , frequency distribution is given below , Class interval Frequency 5-7 8 8-10 14…
Q: 2. Create a Frequency Distribution Table and compute for the Mean, Median, Mode, Variance, and…
A: Central tendency measure used to measure the average of location measure. There are five measures of…
Q: Place the following set of n=20 scores in a frequency distribution table. 6,2,2,1,3,2,4,7,1,2…
A: The objective is to construct the frequency distribution table for the given 20 scores.
Q: The following table represents a grouped frequency distribution of the number of hours spent…
A: The following table represents a grouped frequency distribution of the number of hours spent…
Q: Here is a sample of checks from the Metro Diner from this past week: $57 $102 $59 $58 $77 $55…
A: Since we only answer up to 3 sub-parts, we’ll answer the first 3. Please resubmit the question and…
Q: Find the median, range, and mean deviation of the following frequency distribution table: Categories…
A:
Q: Thirty-five soccer players were challenged to do as many sit-ups as possible in two minutes. Here…
A: We have to construct frequency distribution for mentioned data First we will arrange data. Than we…
Q: Build the frequency distribution table with 5 classes, and for the following observations for some…
A: One of the critical tasks of statistics is to organize and represent data. The ability to organize…
Q: Find the mode for the scores in the following frequency distribution table: Number Frequency…
A: Note: Considering scores as 16, 15, 13, 12, 11 and the corresponding cumulative frequencies are…
Q: For a sample of 12 offenders convicted of weapons violations, the length of prison sentence in…
A: Solution-: Given data: 6,6,2,12,17,48,60,24,20,20,18,15 What is the shape of this given…
Q: For the following data: 22 37 14 17 27 41 30 13 19 21 49 37 29 20 16 17 34 16…
A: Given Data : 22 37 14 17 27 41 30 13 19 21 49 37 29 20 16 17…
Q: Marks for a university business statistics class are given in the following table. 63 74 42 65 51 54…
A: Since you have posted a question with multiple sub-parts, we will solve first three sub-parts for…
Q: Using the frequency distribution table below, what is the proportion of individuals that scored a 4?…
A: Given data is x f 6 4 5 3 4 7 3 2 2 2 1 2
Q: The table below shows the overtime hours of the employees during a week. Overtime hours 0 1 2 3 4 5…
A:
Q: Twenty farmers were asked how many hours they worked per day. Their responses, in hours, are as…
A: Twenty farmers were asked how many hours they worked per day. Their responses, in hours, are…
Q: Find the mean, median, and mode for the scores in the following frequency distribution table. 4 3 3…
A: From the provided information, The table can be constructed as: Data values (x) Frequency (f)…
Q: Find the mean, median, and mode for the following frequency distribution. f 4 6. 6. 2 7 1 8. 8. 10 4…
A: We need to find mean, median and mode for the following data x f 4 4 5 9 6 2 7 1 8 8…
Q: Find the mean, median, and mode for the scores in the following frequency distribution table. X f…
A: Consider the following rearrangement of the data in the table: x f 0 2 1 0 2 3 3 2 4 5…
Q: Describe the distribution given the following stem and leaf plot: 이 25 1|33 2|0 1 3| 11 4| 27…
A: 0 | 2 5 1 | 3 3 2 | 0 1 3 | 1 1 4 | 2 7
Q: Cherry is a plant lover and everyday she measures the length of the leaves of her plant. The…
A: We want to find frequency distribution, cumulative frequency distribution and relative frequency…
Trending now
This is a popular solution!
Step by step
Solved in 2 steps with 1 images