cores on an accounting exam ranged from 48 to 96, with quartiles Q= 65.00, Q2= 825, and Q3= 85.75. a) Select the correct box plot for the given data. BoxPlot A ВоxPlot B BoxPlot C BoxPlot BoxPlot ВохPlot 40 50 60 70 80 90 100 40 50 60 70 80 90 100 40 50 60 70 O BoxPlot A O BoxPlot B O BoxPlot C b) Describe Its shape (skewed left, symmetric, skewed right). O The distribution Is skewed right. O The distribution Is symmetric. O The distribution is skewed left. < Prev 13 of 19 Next > 口 10:30 PM G 2/26/2022
cores on an accounting exam ranged from 48 to 96, with quartiles Q= 65.00, Q2= 825, and Q3= 85.75. a) Select the correct box plot for the given data. BoxPlot A ВоxPlot B BoxPlot C BoxPlot BoxPlot ВохPlot 40 50 60 70 80 90 100 40 50 60 70 80 90 100 40 50 60 70 O BoxPlot A O BoxPlot B O BoxPlot C b) Describe Its shape (skewed left, symmetric, skewed right). O The distribution Is skewed right. O The distribution Is symmetric. O The distribution is skewed left. < Prev 13 of 19 Next > 口 10:30 PM G 2/26/2022

Algebra & Trigonometry with Analytic Geometry
13th Edition
ISBN:9781133382119
Author:Swokowski
Publisher:Swokowski
Chapter3: Functions And Graphs
Section3.3: Lines
Problem 76E

Related questions
Question
100%
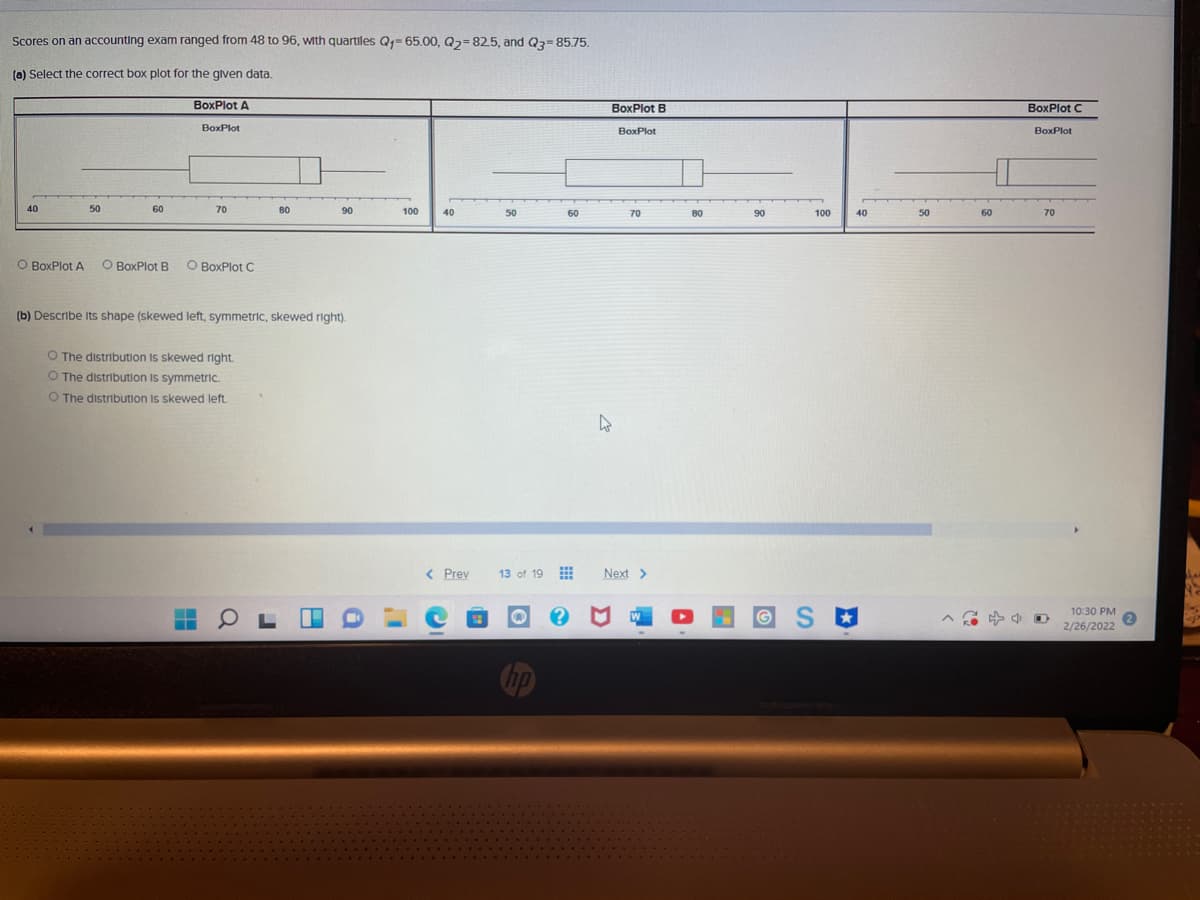
Transcribed Image Text:Scores on an accounting exam ranged from 48 to 96, with quartiles Q- 65.00, Q2=825, and Q3= 85.75.
(0) Select the correct box plot for the glven data.
BoxPlot A
BoxPlot B
BoxPlot C
BoxPlot
BoxPlot
BoxPlot
40
50
60
70
80
90
100
40
50
60
70
80
90
100
40
50
60
70
O BoxPlot A
O BoxPlot B
O BoxPlot C
(b) Describe Its shape (skewed left, symmetric, skewed right).
O The distribution Is skewed right.
O The distribution Is symmetric.
O The distribution Is skewed left.
< Prev
13 of 19 E
Next >
10:30 PM
2/26/2022
hp
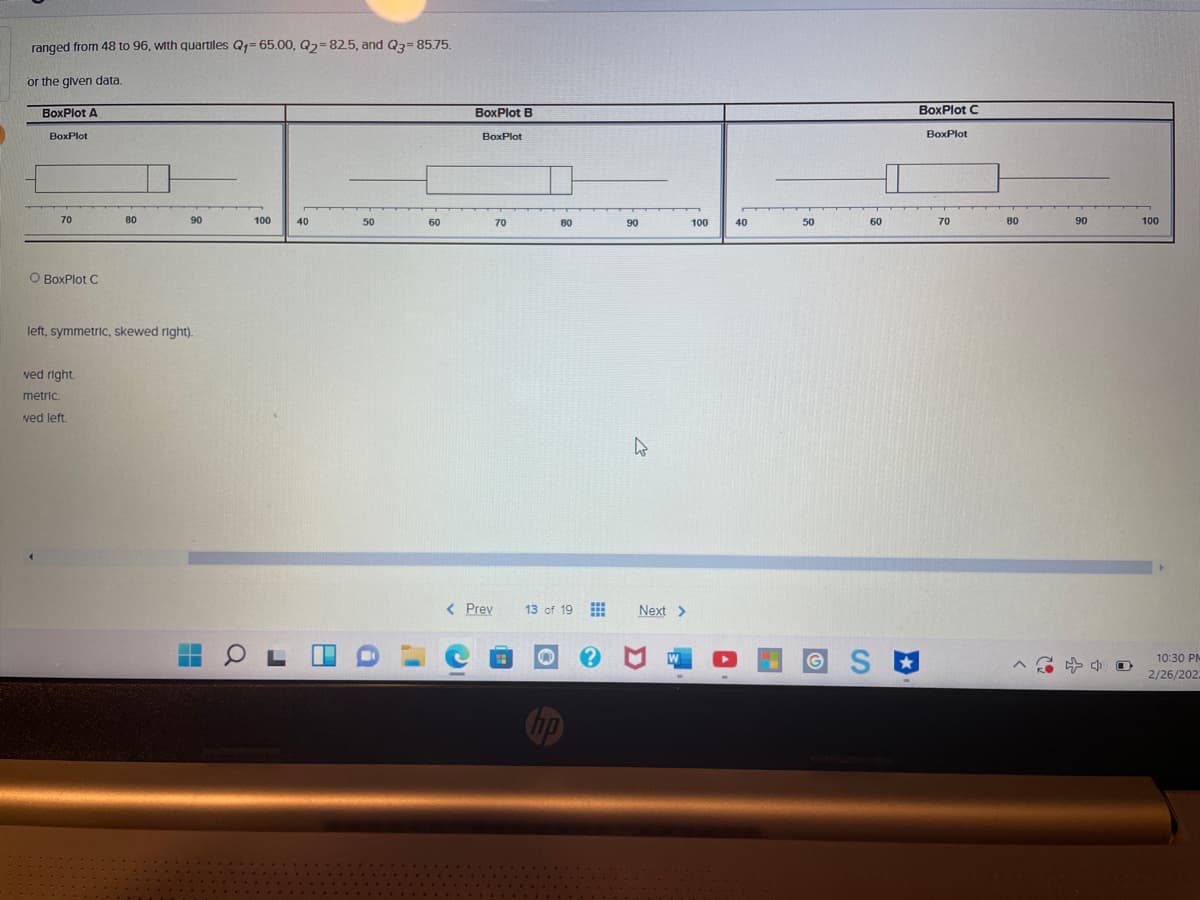
Transcribed Image Text:ranged from 48 to 96, with quartiles Q1= 65.00, Q2=82.5, and Q3=85.75.
or the given data.
BoxPlot A
BoxPlot B
BoxPlot C
BoxPlot
BoxPlot
BoxPlot
70
80
90
100
40
50
60
80
90
100
40
50
60
70
80
90
100
O BoxPlot C
left, symmetric, skewed right).
ved right.
metric.
ved left.
< Prev
13 of 19
Next >
10:30 P-
2/26/202.
Expert Solution
Step 1
Given that
Minimum=48 , Q1=65 , Q2=82.5 , Q3=85.75
Maximum=96

Trending now
This is a popular solution!

Step by step
Solved in 3 steps with 4 images

Recommended textbooks for you
Algebra & Trigonometry with Analytic Geometry
Algebra
ISBN:
9781133382119
Author:
Swokowski
Publisher:
Cengage

Glencoe Algebra 1, Student Edition, 9780079039897…
Algebra
ISBN:
9780079039897
Author:
Carter
Publisher:
McGraw Hill

Big Ideas Math A Bridge To Success Algebra 1: Stu…
Algebra
ISBN:
9781680331141
Author:
HOUGHTON MIFFLIN HARCOURT
Publisher:
Houghton Mifflin Harcourt
Algebra & Trigonometry with Analytic Geometry
Algebra
ISBN:
9781133382119
Author:
Swokowski
Publisher:
Cengage
Glencoe Algebra 1, Student Edition, 9780079039897…
Algebra
ISBN:
9780079039897
Author:
Carter
Publisher:
McGraw Hill
Big Ideas Math A Bridge To Success Algebra 1: Stu…
Algebra
ISBN:
9781680331141
Author:
HOUGHTON MIFFLIN HARCOURT
Publisher:
Houghton Mifflin Harcourt