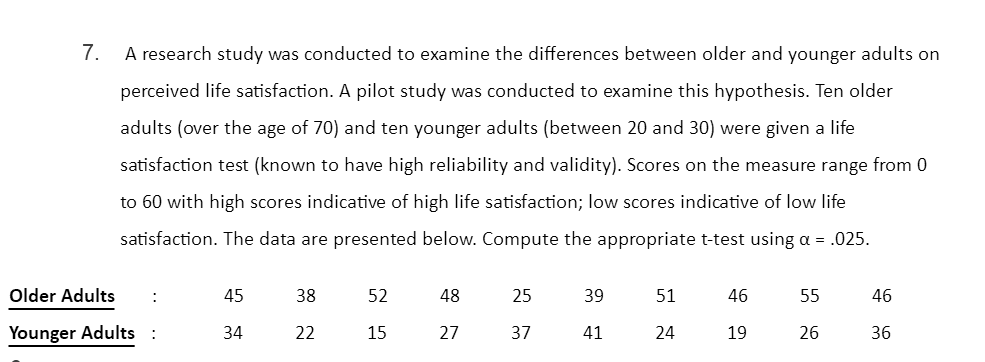
7. A research study was conducted to examine the differences between older and younger adults on perceived life satisfaction. A pilot study was conducted to examine this hypothesis. Ten older adults (over the age of 70) and ten younger adults (between 20 and 30) were given a life satisfaction test (known to have high reliability and validity). Scores on the measure range from 0 to 60 with high scores indicative of high life satisfaction; low scores indicative of low life satisfaction. The data are presented below. Compute the appropriate t-test using a = .025. Older Adults 45 38 52 48 25 39 51 46 55 46 Younger Adults 34 22 15 27 37 41 24 19 26 36
7. A research study was conducted to examine the differences between older and younger adults on perceived life satisfaction. A pilot study was conducted to examine this hypothesis. Ten older adults (over the age of 70) and ten younger adults (between 20 and 30) were given a life satisfaction test (known to have high reliability and validity). Scores on the measure range from 0 to 60 with high scores indicative of high life satisfaction; low scores indicative of low life satisfaction. The data are presented below. Compute the appropriate t-test using a = .025. Older Adults 45 38 52 48 25 39 51 46 55 46 Younger Adults 34 22 15 27 37 41 24 19 26 36

Holt Mcdougal Larson Pre-algebra: Student Edition 2012
1st Edition
ISBN:9780547587776
Author:HOLT MCDOUGAL
Publisher:HOLT MCDOUGAL
Chapter11: Data Analysis And Probability
Section: Chapter Questions
Problem 8CR

Related questions
Question
Transcribed Image Text:7.
A research study was conducted to examine the differences between older and younger adults on
perceived life satisfaction. A pilot study was conducted to examine this hypothesis. Ten older
adults (over the age of 70) and ten younger adults (between 20 and 30) were given a life
satisfaction test (known to have high reliability and validity). Scores on the measure range from 0
to 60 with high scores indicative of high life satisfaction; low scores indicative of low life
satisfaction. The data are presented below. Compute the appropriate t-test using a = .025.
Older Adults
:
45
38
52
48
25
39
51
46
55
46
Younger Adults :
34
22
15
27
37
41
24
19
26
36
Expert Solution
This question has been solved!
Explore an expertly crafted, step-by-step solution for a thorough understanding of key concepts.

This is a popular solution!

Trending now
This is a popular solution!

Step by step
Solved in 3 steps with 4 images

Recommended textbooks for you
Holt Mcdougal Larson Pre-algebra: Student Edition…
Algebra
ISBN:
9780547587776
Author:
HOLT MCDOUGAL
Publisher:
HOLT MCDOUGAL

Glencoe Algebra 1, Student Edition, 9780079039897…
Algebra
ISBN:
9780079039897
Author:
Carter
Publisher:
McGraw Hill
Holt Mcdougal Larson Pre-algebra: Student Edition…
Algebra
ISBN:
9780547587776
Author:
HOLT MCDOUGAL
Publisher:
HOLT MCDOUGAL
Glencoe Algebra 1, Student Edition, 9780079039897…
Algebra
ISBN:
9780079039897
Author:
Carter
Publisher:
McGraw Hill