Country Sri Lanka China Vietnam Great Britain Norway Romania Switzerland Armenia Netherlands India Georgia Kyrgyzstan Costa Rica Brazil Uzbekistan Gold medals Country 0 Thailand 51 Kuwait Bahamas Kenya Trinidad and Tobago Greece 0 19 3 4 2 0 7 0 3 0 0 3 1 Mozambique Kazakhstan Denmark Latvia Czech Republic Hungary Sweden Uruguay United States Gold medals 200 5 0 0 2 2 1 3 3 0 0 36 (a) Make a dotplot to display these data. Describe the overall pattern of the distribution and any deviations from that pattern. (b) Overall, 204 countries participated in the 2008 Summer Olympics, of which 55 won at least one gold medal. Do you believe that the sample of countries listed in the table is representative of this larger popu- lation? Why or why not?
Country Sri Lanka China Vietnam Great Britain Norway Romania Switzerland Armenia Netherlands India Georgia Kyrgyzstan Costa Rica Brazil Uzbekistan Gold medals Country 0 Thailand 51 Kuwait Bahamas Kenya Trinidad and Tobago Greece 0 19 3 4 2 0 7 0 3 0 0 3 1 Mozambique Kazakhstan Denmark Latvia Czech Republic Hungary Sweden Uruguay United States Gold medals 200 5 0 0 2 2 1 3 3 0 0 36 (a) Make a dotplot to display these data. Describe the overall pattern of the distribution and any deviations from that pattern. (b) Overall, 204 countries participated in the 2008 Summer Olympics, of which 55 won at least one gold medal. Do you believe that the sample of countries listed in the table is representative of this larger popu- lation? Why or why not?

MATLAB: An Introduction with Applications
6th Edition
ISBN:9781119256830
Author:Amos Gilat
Publisher:Amos Gilat
Chapter1: Starting With Matlab
Section: Chapter Questions
Problem 1P

Related questions
Question
Solve the attached problem
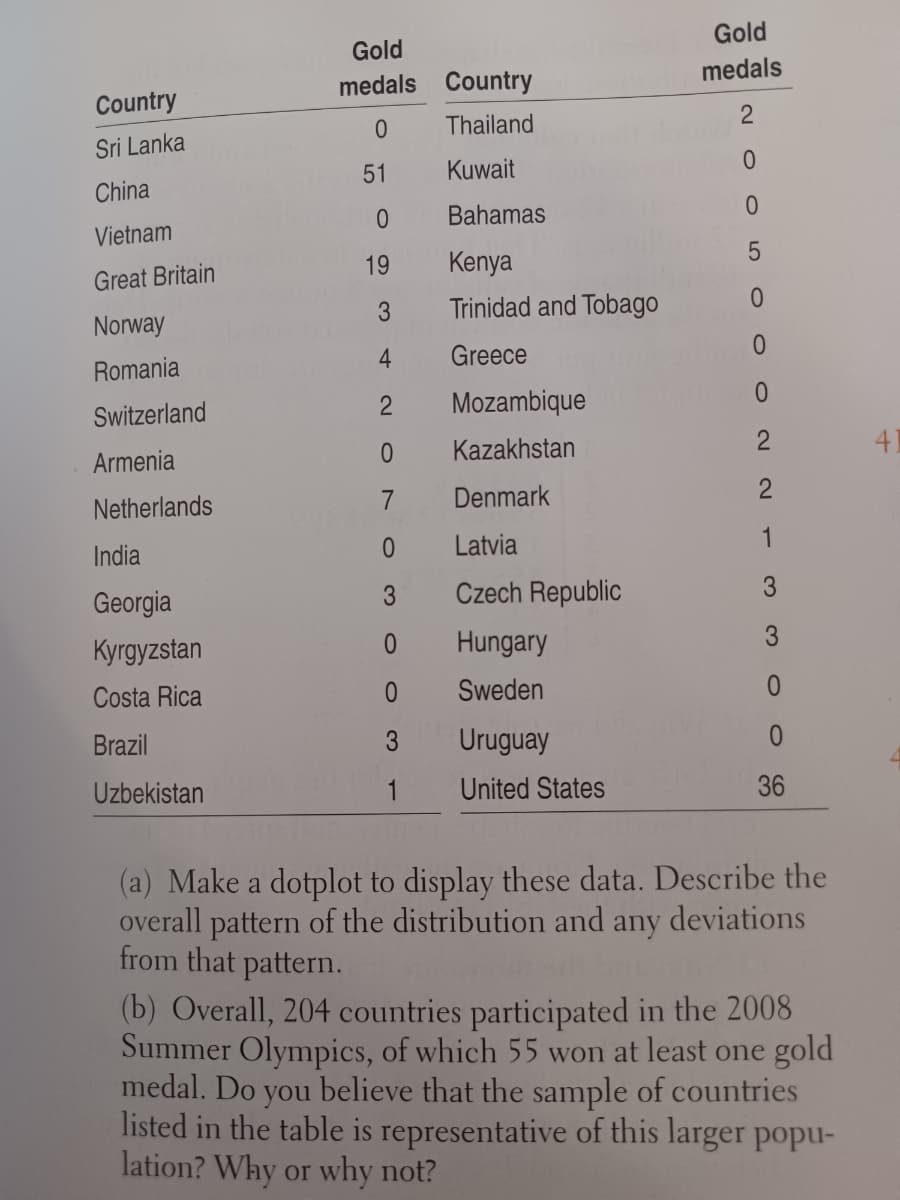
Transcribed Image Text:Country
Sri Lanka
China
Vietnam
Great Britain
Norway
Romania
Switzerland
Armenia
Netherlands
India
Georgia
Kyrgyzstan
Costa Rica
Brazil
Uzbekistan
Gold
medals
0
51
0
19
3
4
2
0
7
0
3
0
1
Country
Thailand
Kuwait
Bahamas
Kenya
Trinidad and Tobago
Greece
Mozambique
Kazakhstan
Denmark
Latvia
Czech Republic
Hungary
Sweden
Uruguay
United States
Gold
medals
2
0
0
5
0
0
2
2
1
3
3
0
36
(a) Make a dotplot to display these data. Describe the
overall pattern of the distribution and any deviations
from that pattern.
(b) Overall, 204 countries participated in the 2008
Summer Olympics, of which 55 won at least one gold
medal. Do you believe that the sample of countries
listed in the table is representative of this larger popu-
lation? Why or why not?
Expert Solution
This question has been solved!
Explore an expertly crafted, step-by-step solution for a thorough understanding of key concepts.

Step by step
Solved in 3 steps with 1 images

Recommended textbooks for you
MATLAB: An Introduction with Applications
Statistics
ISBN:
9781119256830
Author:
Amos Gilat
Publisher:
John Wiley & Sons Inc

Probability and Statistics for Engineering and th…
Statistics
ISBN:
9781305251809
Author:
Jay L. Devore
Publisher:
Cengage Learning

Statistics for The Behavioral Sciences (MindTap C…
Statistics
ISBN:
9781305504912
Author:
Frederick J Gravetter, Larry B. Wallnau
Publisher:
Cengage Learning
MATLAB: An Introduction with Applications
Statistics
ISBN:
9781119256830
Author:
Amos Gilat
Publisher:
John Wiley & Sons Inc
Probability and Statistics for Engineering and th…
Statistics
ISBN:
9781305251809
Author:
Jay L. Devore
Publisher:
Cengage Learning
Statistics for The Behavioral Sciences (MindTap C…
Statistics
ISBN:
9781305504912
Author:
Frederick J Gravetter, Larry B. Wallnau
Publisher:
Cengage Learning

Elementary Statistics: Picturing the World (7th E…
Statistics
ISBN:
9780134683416
Author:
Ron Larson, Betsy Farber
Publisher:
PEARSON

The Basic Practice of Statistics
Statistics
ISBN:
9781319042578
Author:
David S. Moore, William I. Notz, Michael A. Fligner
Publisher:
W. H. Freeman

Introduction to the Practice of Statistics
Statistics
ISBN:
9781319013387
Author:
David S. Moore, George P. McCabe, Bruce A. Craig
Publisher:
W. H. Freeman