In trying to determine the relationship between consumer sentiment on annualized GDP growth, you collect data for 40 quarters, and regress GDP growth as the dependent variable on consumer sentiment as independent variable. The data statistics and regression results are as follows: GDP growth Sentiment 97 Mean 2.6 St.Dev. 2.9 Regression results: R-squared Standard error 0.51 0.56 Intercept 2.34 Intercept std. error 1.6 0.29 0.11 Slope Slope std. error What is the variance of the prediction error if you try to predict GDP growth when consumer sentiment 95, using the results of this regression? (Bonus thinking question: Is your prediction statistically different from zero at a 5% level of significance?)
In trying to determine the relationship between consumer sentiment on annualized GDP growth, you collect data for 40 quarters, and regress GDP growth as the dependent variable on consumer sentiment as independent variable. The data statistics and regression results are as follows: GDP growth Sentiment 97 Mean 2.6 St.Dev. 2.9 Regression results: R-squared Standard error 0.51 0.56 Intercept 2.34 Intercept std. error 1.6 0.29 0.11 Slope Slope std. error What is the variance of the prediction error if you try to predict GDP growth when consumer sentiment 95, using the results of this regression? (Bonus thinking question: Is your prediction statistically different from zero at a 5% level of significance?)

College Algebra
7th Edition
ISBN:9781305115545
Author:James Stewart, Lothar Redlin, Saleem Watson
Publisher:James Stewart, Lothar Redlin, Saleem Watson
Chapter1: Equations And Graphs
Section: Chapter Questions
Problem 10T: Olympic Pole Vault The graph in Figure 7 indicates that in recent years the winning Olympic men’s...

Related questions
Question
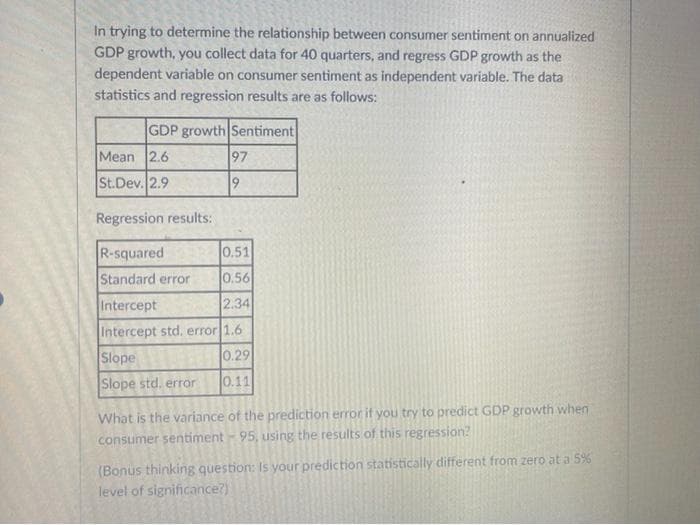
Transcribed Image Text:In trying to determine the relationship between consumer sentiment on annualized
GDP growth, you collect data for 40 quarters, and regress GDP growth as the
dependent variable on consumer sentiment as independent variable. The data
statistics and regression results are as follows:
GDP growth Sentiment
Mean 2.6
St.Dev. 2.9
97
9
Regression results:
R-squared
0.51
Standard error 0.56
Intercept
2.34
Intercept std. error 1.6
0.29
0.11
Slope
Slope std. error
What is the variance of the prediction error if you try to predict GDP growth when
consumer sentiment 95, using the results of this regression?
(Bonus thinking question: Is your prediction statistically different from zero at a 5%
level of significance?)
Expert Solution
This question has been solved!
Explore an expertly crafted, step-by-step solution for a thorough understanding of key concepts.

Step by step
Solved in 5 steps

Recommended textbooks for you
College Algebra
Algebra
ISBN:
9781305115545
Author:
James Stewart, Lothar Redlin, Saleem Watson
Publisher:
Cengage Learning

Algebra and Trigonometry (MindTap Course List)
Algebra
ISBN:
9781305071742
Author:
James Stewart, Lothar Redlin, Saleem Watson
Publisher:
Cengage Learning

Glencoe Algebra 1, Student Edition, 9780079039897…
Algebra
ISBN:
9780079039897
Author:
Carter
Publisher:
McGraw Hill
College Algebra
Algebra
ISBN:
9781305115545
Author:
James Stewart, Lothar Redlin, Saleem Watson
Publisher:
Cengage Learning
Algebra and Trigonometry (MindTap Course List)
Algebra
ISBN:
9781305071742
Author:
James Stewart, Lothar Redlin, Saleem Watson
Publisher:
Cengage Learning
Glencoe Algebra 1, Student Edition, 9780079039897…
Algebra
ISBN:
9780079039897
Author:
Carter
Publisher:
McGraw Hill

Functions and Change: A Modeling Approach to Coll…
Algebra
ISBN:
9781337111348
Author:
Bruce Crauder, Benny Evans, Alan Noell
Publisher:
Cengage Learning

Big Ideas Math A Bridge To Success Algebra 1: Stu…
Algebra
ISBN:
9781680331141
Author:
HOUGHTON MIFFLIN HARCOURT
Publisher:
Houghton Mifflin Harcourt