Given in the table are the BMI statistics for random samples of men and women. Assume that the two samples are independent simple random samples selected from normally distributed populations, and do not assume that the population standard deviations are equal. Complete parts (a) and (b) below. Use a 0.01 significance level for both parts. F n XS Male BMI Female BMI H₁ H₂ 47 47 27.3601 26.3701 8.190898 5.189236
Given in the table are the BMI statistics for random samples of men and women. Assume that the two samples are independent simple random samples selected from normally distributed populations, and do not assume that the population standard deviations are equal. Complete parts (a) and (b) below. Use a 0.01 significance level for both parts. F n XS Male BMI Female BMI H₁ H₂ 47 47 27.3601 26.3701 8.190898 5.189236

Glencoe Algebra 1, Student Edition, 9780079039897, 0079039898, 2018
18th Edition
ISBN:9780079039897
Author:Carter
Publisher:Carter
Chapter10: Statistics
Section10.4: Distributions Of Data
Problem 19PFA

Related questions
Question
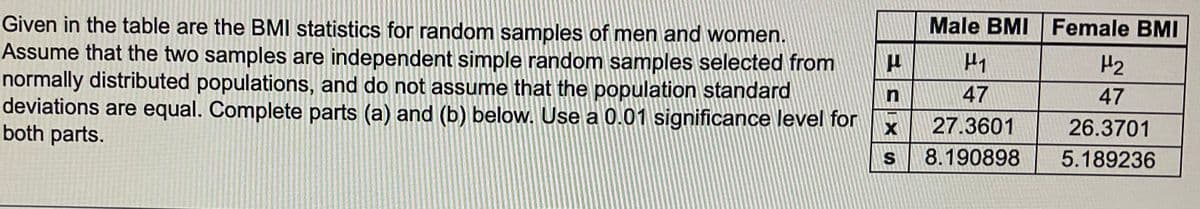
Transcribed Image Text:Given in the table are the BMI statistics for random samples of men and women.
Assume that the two samples are independent simple random samples selected from
normally distributed populations, and do not assume that the population standard
deviations are equal. Complete parts (a) and (b) below. Use a 0.01 significance level for
both parts.
ESIXS
n
Male BMI Female BMI
H₂
H₁
47
47
27.3601
26.3701
8.190898
5.189236
Expert Solution
This question has been solved!
Explore an expertly crafted, step-by-step solution for a thorough understanding of key concepts.

This is a popular solution!

Trending now
This is a popular solution!

Step by step
Solved in 5 steps with 9 images

Follow-up Questions
Read through expert solutions to related follow-up questions below.
Recommended textbooks for you
Glencoe Algebra 1, Student Edition, 9780079039897…
Algebra
ISBN:
9780079039897
Author:
Carter
Publisher:
McGraw Hill
Glencoe Algebra 1, Student Edition, 9780079039897…
Algebra
ISBN:
9780079039897
Author:
Carter
Publisher:
McGraw Hill