Create a total displacement versus time graph. DO NOT calculate any slope. What do you notice about the data points? Create a velocity versus time graph. Make sure that you properly label the graph. /3. Indicate any sections on the graph where the velocity is constant or changing.
Create a total displacement versus time graph. DO NOT calculate any slope. What do you notice about the data points? Create a velocity versus time graph. Make sure that you properly label the graph. /3. Indicate any sections on the graph where the velocity is constant or changing.

Glencoe Physics: Principles and Problems, Student Edition
1st Edition
ISBN:9780078807213
Author:Paul W. Zitzewitz
Publisher:Paul W. Zitzewitz
Chapter2: Representing Motion
Section2.4: How Fast?
Problem 29PP

Related questions
Question
100%
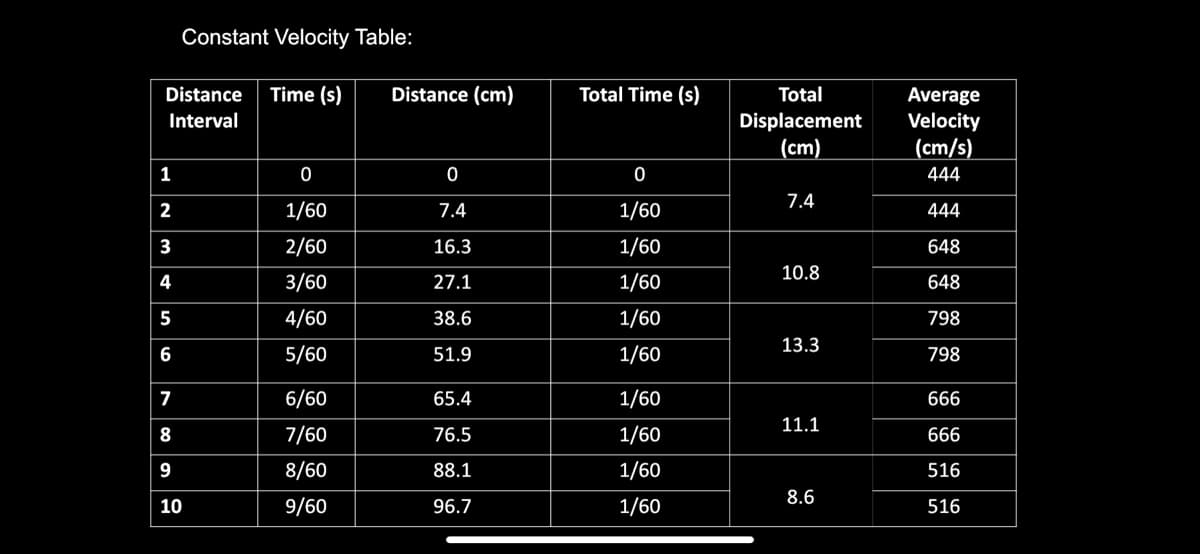
Transcribed Image Text:Constant Velocity Table:
Distance
Time (s)
Distance (cm)
Total Time (s)
Total
Displacement
(cm)
Average
Velocity
(cm/s)
Interval
1
444
7.4
2
1/60
7.4
1/60
444
3
2/60
16.3
1/60
648
10.8
4
3/60
27.1
1/60
648
5
4/60
38.6
1/60
798
13.3
6
5/60
51.9
1/60
798
7
6/60
65.4
1/60
666
11.1
8
7/60
76.5
1/60
666
9
8/60
88.1
1/60
516
8.6
10
9/60
96.7
1/60
516
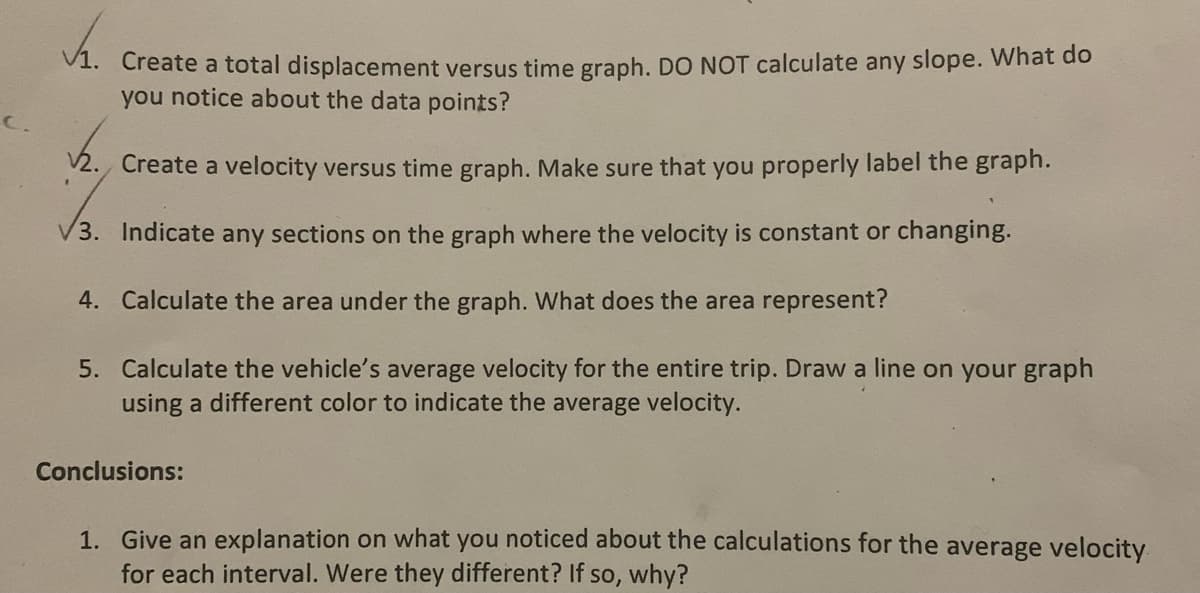
Transcribed Image Text:V1. Create a total displacement versus time graph. DO NOT calculate any slope. What do
you notice about the data points?
C.
V2. Create a velocity versus time graph. Make sure that you properly label the graph.
V3. Indicate any sections on the graph where the velocity is constant or changing.
4. Calculate the area under the graph. What does the area represent?
5. Calculate the vehicle's average velocity for the entire trip. Draw a line on your graph
using a different color to indicate the average velocity.
Conclusions:
1. Give an explanation on what you noticed about the calculations for the average velocity
for each interval. Were they different? If so, why?
Expert Solution
This question has been solved!
Explore an expertly crafted, step-by-step solution for a thorough understanding of key concepts.

Step by step
Solved in 4 steps with 2 images

Knowledge Booster


Learn more about
Need a deep-dive on the concept behind this application? Look no further. Learn more about this topic, physics and related others by exploring similar questions and additional content below.Recommended textbooks for you
Glencoe Physics: Principles and Problems, Student…
Physics
ISBN:
9780078807213
Author:
Paul W. Zitzewitz
Publisher:
Glencoe/McGraw-Hill

Physics for Scientists and Engineers, Technology …
Physics
ISBN:
9781305116399
Author:
Raymond A. Serway, John W. Jewett
Publisher:
Cengage Learning

University Physics Volume 3
Physics
ISBN:
9781938168185
Author:
William Moebs, Jeff Sanny
Publisher:
OpenStax
Glencoe Physics: Principles and Problems, Student…
Physics
ISBN:
9780078807213
Author:
Paul W. Zitzewitz
Publisher:
Glencoe/McGraw-Hill
Physics for Scientists and Engineers, Technology …
Physics
ISBN:
9781305116399
Author:
Raymond A. Serway, John W. Jewett
Publisher:
Cengage Learning
University Physics Volume 3
Physics
ISBN:
9781938168185
Author:
William Moebs, Jeff Sanny
Publisher:
OpenStax

College Physics
Physics
ISBN:
9781938168000
Author:
Paul Peter Urone, Roger Hinrichs
Publisher:
OpenStax College