Customer Location Freight Car Location A. Milwaukee B. Omaha C. Topeka D. Tucson E. Denver F. Wichita G. Minneapolis H. Memphis L. Kansas City Supply 1. Portland 27 23 23 26 21 29 40 45 23 1,100 2. Fresno 31 26 25 22 20 34 47 43 26 720 3. Long 38 31 32 18 24 27 51 48 34 1,450 Beach 4. Salt Lake 28 18 17 24 9. 20 32 35 19 980 City 5. El Paso 41 27 24 11 18 22 46 30 25 650 6. Houston 38 24 22 16 27 25 41 28 23 1,025 7. St. Louis 8. Chicago 15 14 10 27 23 12 19 10 9. 1,330 12 13 15 31 26 17 14 15 14 1,275 Demand 974 1,225 1,690 710 1,261 663 301 479 1,227


Critical Path Method
The critical path is the longest succession of tasks that has to be successfully completed to conclude a project entirely. The tasks involved in the sequence are called critical activities, as any task getting delayed will result in the whole project getting delayed. To determine the time duration of a project, the critical path has to be identified. The critical path method or CPM is used by project managers to evaluate the least amount of time required to finish each task with the least amount of delay.
Cost Analysis
The entire idea of cost of production or definition of production cost is applied corresponding or we can say that it is related to investment or money cost. Money cost or investment refers to any money expenditure which the firm or supplier or producer undertakes in purchasing or hiring factor of production or factor services.
Inventory Management
Inventory management is the process or system of handling all the goods that an organization owns. In simpler terms, inventory management deals with how a company orders, stores, and uses its goods.
Project Management
Project Management is all about management and optimum utilization of the resources in the best possible manner to develop the software as per the requirement of the client. Here the Project refers to the development of software to meet the end objective of the client by providing the required product or service within a specified Period of time and ensuring high quality. This can be done by managing all the available resources. In short, it can be defined as an application of knowledge, skills, tools, and techniques to meet the objective of the Project. It is the duty of a Project Manager to achieve the objective of the Project as per the specifications given by the client.
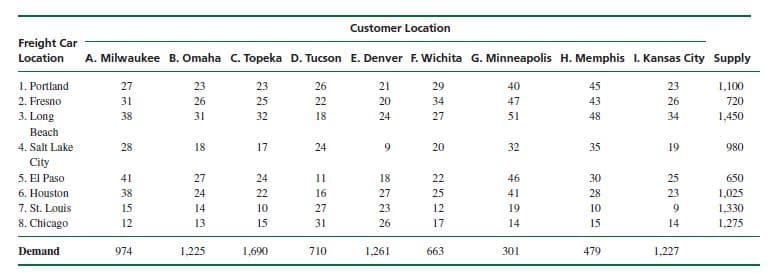
The National Western Railroad’s rail network covers most of the U.S. West and Midwest. On a
daily basis it sends empty freight cars from various locations in its rail network to its customers
for their use. Sometimes there are not enough freight cars to meet customer demand. The transportation
costs for shipping empty freight cars, shown as follows, are directly related to distance
traveled and the number of rail centers that must handle the car movement. Determine the number of empty freight cars that should be sent from each rail network location
to customers to meet demand at the minimum total cost.


Trending now
This is a popular solution!

Step by step
Solved in 3 steps


