(d) Calculate the error sum of squares, which is a measure of within SSE = (use four decimals in your answer) (e) Complete the ANOVA table. Note that you've already found two of the three sums of squares. Use four the F test statistic to 2 decimals. The appropriate hypotheses are: O Ho: 12 = μ3 = μ¹4 Ha: 1
(d) Calculate the error sum of squares, which is a measure of within SSE = (use four decimals in your answer) (e) Complete the ANOVA table. Note that you've already found two of the three sums of squares. Use four the F test statistic to 2 decimals. The appropriate hypotheses are: O Ho: 12 = μ3 = μ¹4 Ha: 1

MATLAB: An Introduction with Applications
6th Edition
ISBN:9781119256830
Author:Amos Gilat
Publisher:Amos Gilat
Chapter1: Starting With Matlab
Section: Chapter Questions
Problem 1P

Related questions
Question
100%
STATISTICS(UPVOTE WILL BE GIVEN. PLEASE ANSWER THE FOLLOWING PROBLEMS. FOLLW THE INSTRUCTION CAREFULLY NO LONG EXPLANATION NEEDED. BOX THE FINAL ANSWERS.)
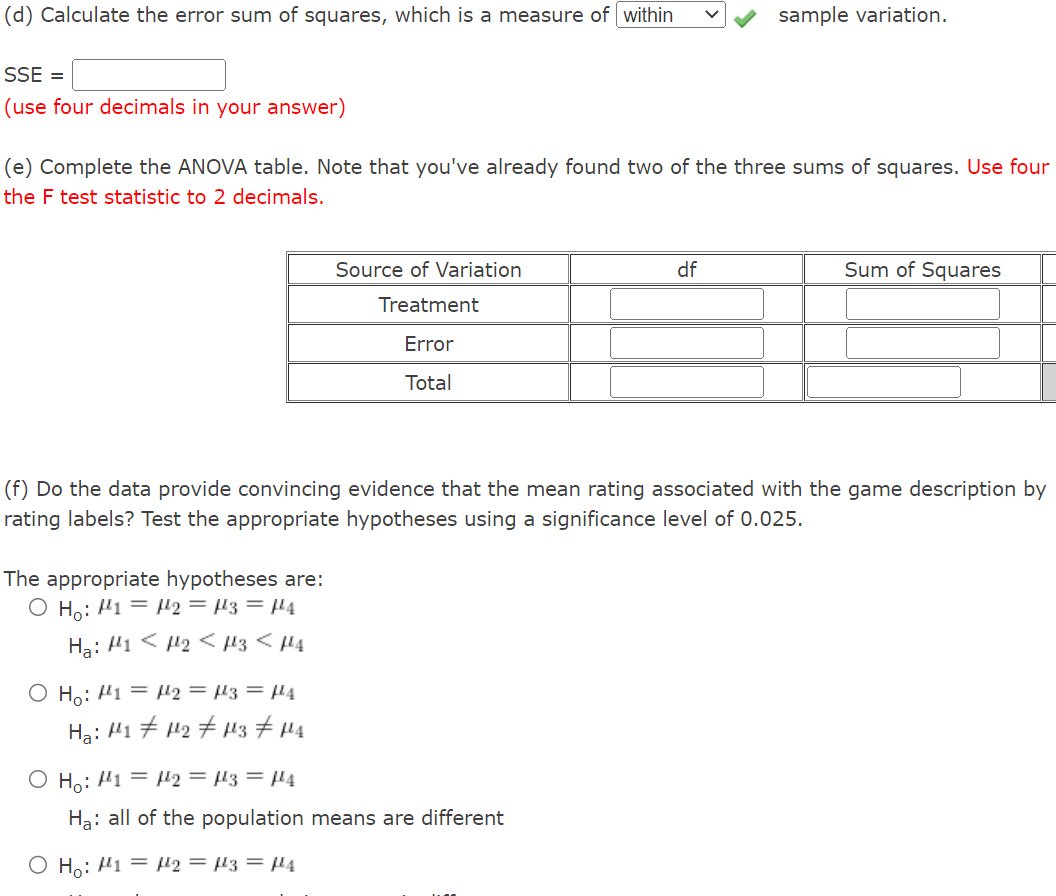
Transcribed Image Text:(d) Calculate the error sum of squares, which is a measure of within
SSE =
(use four decimals in your answer)
(e) Complete the ANOVA table. Note that you've already found two of the three sums of squares. Use four
the F test statistic to 2 decimals.
The appropriate hypotheses are:
O Ho: 12 = 13 = μ¹4
Ha: H1
H₂ H3 <H4
O Ho: 1 =
H₂: 141
Source of Variation
Treatment
Error
Total
₂ = μ3 = μ¹4
14₂ 143 144
(f) Do the data provide convincing evidence that the mean rating associated with the game description by
rating labels? Test the appropriate hypotheses using a significance level of 0.025.
sample variation.
df
O Ho: 1 = 2 = μ3 = μ¹4
Ha: all of the population means are different
O Ho: H1 H2 = 3 = 4
Sum of Squares
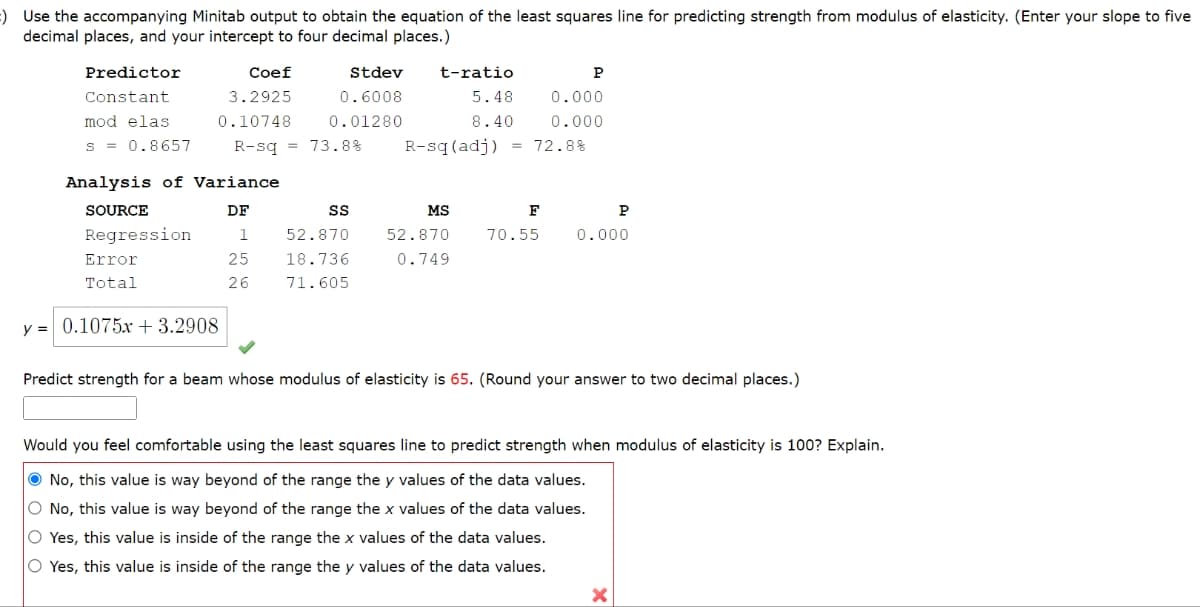
Transcribed Image Text::) Use the accompanying Minitab output to obtain the equation of the least squares line for predicting strength from modulus of elasticity. (Enter your slope to five
decimal places, and your intercept to four decimal places.)
Predictor
Constant
Coef
3.2925
mod elas
0.10748
s = 0.8657 R-sq 73.8%
Analysis of Variance
SOURCE
DF
Regression
1
25
26
Error
Total
Stdev
0.6008
0.01280
y = 0.1075x + 3.2908
SS
52.870
18.736
71.605
t-ratio
P
5.48
0.000
8.40
0.000
R-sq (adj) = 72.8%
MS
52.870
0.749
F
70.55
P
0.000
Predict strength for a beam whose modulus of elasticity is 65. (Round your answer to two decimal places.)
Would you feel comfortable using the least squares line to predict strength when modulus of elasticity is 100? Explain.
No, this value is way beyond of the range the y values of the data values.
O No, this value is way beyond of the range the x values of the data values.
O Yes, this value is inside of the range the x values of the data values.
O Yes, this value is inside of the range the y values of the data values.
X
Expert Solution
This question has been solved!
Explore an expertly crafted, step-by-step solution for a thorough understanding of key concepts.

Step by step
Solved in 4 steps

Recommended textbooks for you
MATLAB: An Introduction with Applications
Statistics
ISBN:
9781119256830
Author:
Amos Gilat
Publisher:
John Wiley & Sons Inc

Probability and Statistics for Engineering and th…
Statistics
ISBN:
9781305251809
Author:
Jay L. Devore
Publisher:
Cengage Learning

Statistics for The Behavioral Sciences (MindTap C…
Statistics
ISBN:
9781305504912
Author:
Frederick J Gravetter, Larry B. Wallnau
Publisher:
Cengage Learning
MATLAB: An Introduction with Applications
Statistics
ISBN:
9781119256830
Author:
Amos Gilat
Publisher:
John Wiley & Sons Inc
Probability and Statistics for Engineering and th…
Statistics
ISBN:
9781305251809
Author:
Jay L. Devore
Publisher:
Cengage Learning
Statistics for The Behavioral Sciences (MindTap C…
Statistics
ISBN:
9781305504912
Author:
Frederick J Gravetter, Larry B. Wallnau
Publisher:
Cengage Learning

Elementary Statistics: Picturing the World (7th E…
Statistics
ISBN:
9780134683416
Author:
Ron Larson, Betsy Farber
Publisher:
PEARSON

The Basic Practice of Statistics
Statistics
ISBN:
9781319042578
Author:
David S. Moore, William I. Notz, Michael A. Fligner
Publisher:
W. H. Freeman

Introduction to the Practice of Statistics
Statistics
ISBN:
9781319013387
Author:
David S. Moore, George P. McCabe, Bruce A. Craig
Publisher:
W. H. Freeman