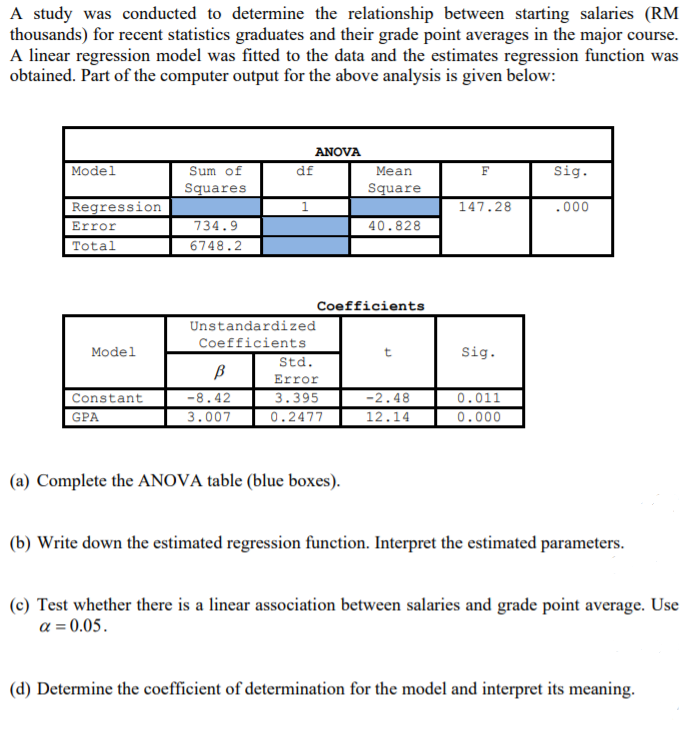
(d) Determine the coefficient of determination for the model and interpret its meaning.


Q: Analysis of the data from 25 mothers indicates that an infant's birth weight (g), y, can be…
A: From the provided information, The regression equation is as follow: y = 31x + 1501 Here x is the…
Q: Find the equation of the regression line
A: Lemon Imports (x) : 230,260,365,467,550 Crash Fatality rate(y): 16, 15.9,15.7,15.4,15.1 Total…
Q: Researchers wanted to investigate the relationship between employment and accommodation capacity in…
A: Let us define X as the number of overnight establishments and Y as the number of Jobs. Given…
Q: Need an example of multiple linear regression
A: Multiple linear regression is where more than one independent value, meaning that we try to predict…
Q: If the regresssion equation for a set of data is Y' = 2.650X+11.250 then the value of Y' for X = 33…
A:
Q: (a) Fit the multiple regression model to these data. (b) Interpret the meaning of the slopes b1 and…
A: Hello! As you have posted more than 3 sub parts, we are answering the first 3 sub-parts. In case…
Q: A statistics consulting center at a major university analyzed data on normal woodchucks for the…
A: From the table: n=19 ∑y=59060 ∑xy=753559.5∑x=244.2 ∑x2=3212.36
Q: (b) Interpret the regression coefficient for the fitted model.
A: Given, n=30, Sxx=759.8148 s=4.69245
Q: Explain the difference between examining relationships between variables graphically and…
A: Correlation refers to the statistical relationship between two variables.
Q: The number of rushing yards per year by a running back af a team has increased approximately…
A: We have to find out the linear equation model
Q: The number of hours 13 students spent studying for an exam and their scores on that test are…
A:
Q: c) Write down the regression equation.
A: Given : X = Salary Y = Holiday Price 23000 450 30000 870 27000 690 19000 380 21000 520…
Q: Determine the best (according to sum-of-squares-measure) curve y =Axb through the data above.…
A: First we will calculate: The sum of squares obtained from the table are: SSXX=∑i=1nXi2-1n∑i=1nXi2…
Q: Find the regression model for the data given
A: The objective is to determine the regression model for the given data.
Q: What are the three requirements of linear regression?
A: these are the following three requirement of linear regression
Q: a. Determine the regression equation. ( places.)
A: a. The sums are, x y x-x¯ y-y¯ x-x¯2 y-y¯2 x-x¯y-y¯ 5 13 0.125 2.375 0.016 5.641 0.297 3 15…
Q: Based on your answer in (b), explain on the strength and the variation of the model. (e) At…
A: R2 measures the strength of the relationship between the model and the dependent variable Given, α…
Q: Write the multiple regression equation for miles per gallon as the response variable. Use weight and…
A: A regression equation models the dependent relationship of two or more variables. It is a measure of…
Q: How do you fit a linear regression model to data in R?
A: Note: Hey there! Thank you for the question. As this is a generalized question, we have explained…
Q: Explain the Regression Equations if we have two variables X and Y?
A: Regression analysis: Regression analysis estimates the relationship among variables. That is, it…
Q: (a) Demonstrate the two important things that should be done before one performs regression…
A: Regression analysis examines the relationship between one or more variables. So two things that can…
Q: The regression equation is y
A: The diameter and circumferences are given and the regression equation is required. The diameter…
Q: An automotive engineer studied the effect of car weight in tons on fuel efficiency, which is…
A: Since the relation between efficiency and weight follows the linear model, we can use formula for…
Q: The regression equation relating attitude rating(x) and job performance (y) for ten randomly…
A: Regression equation:The regression tells about the relationship of two variables, one dependent and…
Q: What are the functional forms of the regression model? Explain.
A: A functional form refers to the algebraic form of a relationship between a dependent variable and…
Q: In a quantitative analysis where widowed people suffering with bereavement suffer with a poor…
A: Solution: Given that in a quantitative analysis where widowed people suffering with bereavement…
Q: b) Determine the multiple regression model for this analysis.
A: Intercept = 657.053 x1 = 5.7103 x2 = -0.4169 x3 = -3.4715
Q: elate dala Del , of a linear model represents how the two types of data change i value.
A: The answer is given below
Q: Explain the term Linearity?
A: When there are two quantitative variables, as one variable increases/decreases, the other variable…
Q: Find the regression model.
A: We have used the excel data analysis tool to run the regression analysis.
Q: The equation used to predict annual cauliflower yield (in pounds per acre) is y = 24,677 + 4.556x, -…
A: The regression equation is given as,
Q: Expalin the concept of Nonlinear Regression Functions in detail?
A: Nonlinear function: Nonlinear regression is a form of regression analysis is defined as fit to a…
Q: State the regression equation and use it to predict taxes for a house with lot size 10K.
A: Dependent variable (y) : Taxes Independent variable (x) : Lotsize Let us assume the regression…
Q: How to interpret these values for a logistical regression model?
A: Consider the given output that shows the summary statistics.
Q: Find The regression equation of Y on X.
A: The regressiinnequation of Y on X is defined as Y = a + bX Where, b is a slope Ans a is y- intercept
Q: A numerical quantity that measures the strength of the linear relationship between two variables is…
A:
Q: How does utilizing linear regression benefit or help a business?
A: Linear regression analysis is a statistical method to find the relationship between two or more…
Q: Illustrate the importance of using regression models.
A: What is Regression Analysis ? Regression analysis is a method of mathematically sorting out which…
Q: Suppose that you have the following model and data to estimate the following equation
A: Given information: Given data represents the values of independent variables X2, X3 and the…
Q: Describe the process to identify the parameter values?
A: The parameter is something in equation or expression that is passed on equation or expression.…
Q: What is Linearization?
A: Linearization Linearization is finding the linear approximation to a function at a given point.…
Q: a) Write out the regression equation using the results from above. b) Interpret the coefficient on…
A: The regression line is given by Price = 27877.15 +551.15AmericanMage - 1390.84Weight
Q: This was not the correct quadratic model for the data
A: Each regression equation has only one dependent variable. Regression equation explain the…
Q: Use the given data to find the best predicted value of the response variable. Four pairs of data…
A: We have given that r=0.942 Y^=3x Y=12.75 We have to find out the best predicted value of y for x =…
Q: In a snow geese feeding trial, a model was constructed relating gosling** weight change (Y), to…
A: Given Solution:
Q: What is the TSS of the model?
A:
Q: Explain the Regression Functions That Are Nonlinear in the Parameters?
A: Regression functions. The regression functions support the fitting of an ordinary-least-squares…
Q: Accountants at the Tucson firm, Larry Youdelman,CPAs, believed that several traveling executives…
A: Given data is y=90+48.50x1+0.40x2 Here, x1 = number of days x2 = distance traveled Correlation…
Q: Explain the roles of tenter and tremove in stepwise regression.
A: Stepwise regression method:Stepwise regression method is a combination of forward selection method…
answer for d

Step by step
Solved in 2 steps with 2 images

- Suppose that a regional express delivery service company wants to estimate the cost of shipping a package (Y) as a function of cargo type, where cargo type includes the following possibilities: fragile, semi-fragile, and durable. Costs for 15 randomly chosen packages of approximately the same weight and same distance shipped, but of different cargo types, are provided in the file P14_16.xlsx. a. Estimate a regression equation using the given sample data, and interpret the estimated regression coefficients. b. According to the estimated regression equation, which cargo type is the most costly to ship? Which cargo type is the least costly to ship? c. How well does the estimated equation fit the given sample data? How might the fit be improved? d. Given the estimated regression equation, predict the cost of shipping a package with semi-fragile cargo.A year-long fitness center study sought to determine if there is a relationship between the amount of muscle mass gained y(kilograms) and the weekly time spent working out under the guidance of a trainer x(minutes). The resulting least-squares regression line for the study is y=2.04 + 0.12x A) predictions using this equation will be fairly good since about 95% of the variation in muscle mass can be explained by the linear relationship with time spent working out. B)Predictions using this equation will be faily good since about 90.25% of the variation in muscle mass can be explained by the linear relationship with time spent working out C)Predictions using this equation will be fairly poor since only about 95% of the variation in muscle mass can be explained by the linear relationship with time spent working out D) Predictions using this equation will be fairly poor since only about 90.25% of the variation in muscle mass can be explained by the linear relationship with time spent…The data regarding the production of wheat in tons (X) and the price of the kilo of flour in Ghana cedis (Y) Takoradi some years ago were: a. Fit the regression line for the day using the method of least squares
- A research department of an American automobile company wants to develop a model topredict gasoline mileage (measured in MPG) of the company’s vehicles by using theirhorsepower and weights (measured in pounds). To do this, it took a random sample of 50vehicles to perform a regression analysis as follows: SUMMARYOUTPUTRegression StatisticsMultiple R 0.865689R Square 0.749417Adjusted RSquare 0.738754Standard Error 4.176602Observations 50ANOVAdf SS MS FRegression a 2451.973702 1225.987 dResidual b 819.8680976 cTotal 49 3271.8418CoefficientsStandardError t StatIntercept 58.15708 2.658248208 21.87797Horsepower -0.11753 0.032643428 -3.60028Weight -0.00687 0.001401173 -4.90349(a) State the multiple regression equation. Interpret the meanings of the coefficients forhorsepower and weight.(b) Test the validity of this multiple regression equation at the significance level of 1%. Showyour reasoning.(c) The research department claims that the weight of the vehicle is negatively linearly related…Suppose the regression in Equation is estimated using LoSTR andLoEL in place of HiSTR and HiEL, where LoSTR = 1 - HiSTR is anindicator for a low-class-size district and LoEL = 1 - HiEL is an indicatorfor a district with a low percentage of English learners. What are thevalues of the estimated regression coefficients?Find the equation of the regression line for the data based on time spend forstudying and current CGPA
- The owner of Original Italian Pizza restaurant chain wants to understand which variable most strongly influences the sales of his specialty deep-dish pizza. He has gathered data on the monthly sales of deep-dish pizzas at his restaurants and observations on other potentially relevant variables for each of several outlets in central Indiana. These data are provided in the file P10_04.xlsx. Estimate a simple linear regression equation between the quantity sold (Y) and each of the following candidates for the best explanatory variable: average price of deep-dish pizzas (X1), monthly advertising expenditures (X2), and disposable income per household in the areas surrounding the outlets (X3). Round your answers for intercept coefficients to the nearest whole number and slope coefficients to two decimal places, if necessary. If your answer is negative number, enter "minus" sign.A large city hospital conducted a study to investigate the relationship between the number of unauthorized days that employees are absent per year and the distance (miles) between home and work for the employees. A sample of 10 employees was selected and the following data were collected. Develop a scatter diagram for these data. Does a linear relationship appear reasonable? Explain. Develop the least squares estimated regression equation that relates the distance to work to the number of days absent. Predict the number of days absent for an employee that lives 5 miles from the hospital.It is required to use the data given in the table to estimate the parameters of the multiple linear regression equation by any of the estimation methods:
- A business statistics professor would like to develop a regression model to predict the final exam scores for students based on their current GPAs, the number of hours they studied for the exam, the number of times they were absent during the semester, and their genders. The data for these variables are given in the accompanying table at the bottom of this page. a) Using Excel, construct a regression model using all of the independent variables. Create the dummy variable Gen, which equals 1 for a male and 0 for a female student ( this assignment is arbitrary) complete the regression equation for the model below, where y= Score, x1= GPA, x2= Hours, x3= Absenses, and x4= Gen. y= (__) + (__)x1 + (__)x2 + (__)x3 + (__)x4 b) Test the significance of the overall regression model using a= 0.10. c) interpret the meaning of the regression coefficient for the dummy variable. d) using the p-values, identify which independent variables are significant with a= 0.10. e) construct a regression…A researcher was investigating variables that might be associated with the academic performance of high school students. The data included the average Math SAS score of all high school seniors in the city that took the exam (labeled as the variable SAT-M), the average number of dollars per pupil spent on education by the city (labeled as the variable $Per Pupil), and the percentage of high school seniors in the city that took the exam (labeled as the variable %Taking). The researcher ran the following multiple linear regression model as SAT-M=Beta0 + Beta1($Per Pupil) + Beta2(%Taking). This model was fit to the data using the method of least-squares, results shown inside of table within photo. If we want to test using ANOVA F-test with hypotheses Ho: Beta1=Beta2=0 versus H1: at least one of the Beta is not 0, what would the value of our F-statistic mean?It is argued that less time spent on social media will result in improved course marks among ECO242 students. To test whether this is the case you collect data from 20 students on their final marks (Y) and number of facebook posts during the semester (X). You make the following calculations: ΣXY = 9057; ΣX2 = 2470; ΣX = 190; ΣY = 1164 Next, you run the following regression: marks=β^1+β^2facebookposts; where β^1 = 86.7855 and β^2 = -3.0090 Question: If the standard error for the intercept parameter estimate is 1.43701, construct a 95% confidence interval for the parameter. Pr( _ ≤β1≤ _)=95%
