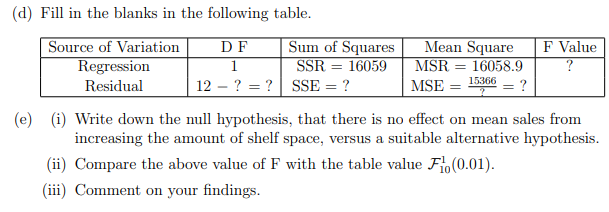
(d) Fill in the blanks in the following table. Source of Variation DF Mean Square F Value Sum of Squares SSR = 16059 1 MSR = 16058.9 ? Regression Residual 12 ? = ? SSE = ? MSE=15366 ? (e) (i) Write down the null hypothesis, that there is no effect on mean sales from increasing the amount of shelf space, versus a suitable alternative hypothesis. (ii) Compare the above value of F with the table value F(0.01). (iii) Comment on your findings.
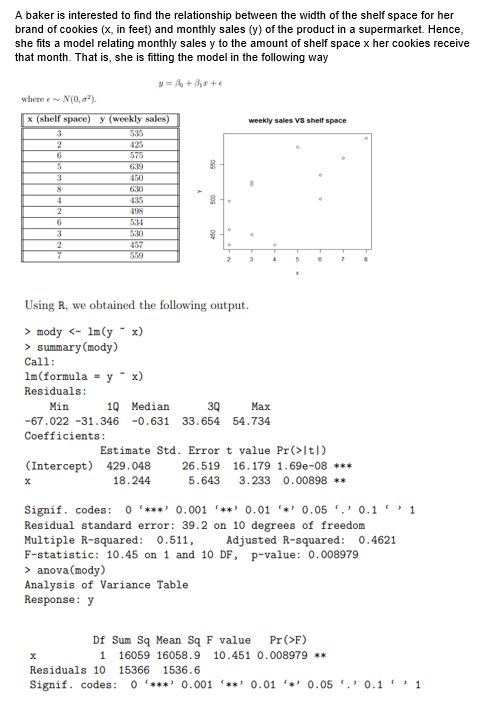
Q: Exercises 9–14, construct the confidence interval for the difference μ1 − μ2 for the given level and…
A:
Q: Q4/ The variance of the frequency distribution is 47 70 87 45 17 33 90 57 72 65 69 35 49 40 10 22 29…
A: Dispersion is used to meausre the spread of data from the mean. It is used to summarize the data…
Q: To achieve statistical significance for a one-sample t-test, is which of the following? the…
A: The statistical significance is essentially described as the inference about the indifference…
Q: A researcher wants to test whether the percentage of the defective items in factory A is more than…
A:
Q: 4. We have the temperatures in several cities of Spain: Aviles (11°C), Barcelona (17°C), Madrid…
A: The given data is 11,17,21,18,18,19,20
Q: A set of data has a normal distribution with a mean of 100 and a standard deviation of 15. Find the…
A:
Q: A company warranties its laptop computers. Every defective laptop costs the company $200 in repair…
A:
Q: ease
A: X Y 62 120 62 140 63 130 65 150 66 142 67 130 68 135 68 175 70 149 72 168…
Q: A fair coin is tossed n times. The histogram for the resulting binomial distribution is labelled 0,…
A: Considering the tossed coin is fair, and assuming a specified face, the Psuccess=Pfailure=0.5. For…
Q: 5. The following data shows the time, in minutes, taken for 12 contestants to complete a task on a…
A:
Q: Treatment I 3 10 7 8 Treatment II 3 4 7 A G
A: Treatment I Treatment II 3 3 10 4 7 7 8 4 10 10 12 2 13 5 12 6
Q: Activity 1: Illustrating Hypothesis Directions: Explicate a null hypothesis and its alternative…
A: Given that Directions: Explicate a null hypothesis and its alternative hypothesis in (a) words and…
Q: What is the probability that the investment has a return of 10% or less? (2 marks). A person must…
A:
Q: List down five (5) different real-life situations where hypothesis testing can be done. Identify the…
A: A Parameter denotes the true value that would be obtained if a census rather than a sample were…
Q: Question In the PRF represented in the equation (1), assume the error term u¡ ~ i.i.d N(0,♂²), prove…
A:
Q: "According to Dietary Goals for the US (1977), high sodium intake may be related to ulcers, stomach…
A: The following information has been provided. Hypothesized population mean = 220 Sample mean = 230…
Q: question 17 The table below shows the number of state-registered automatic weapons and the murder…
A: We have given that y=0.86x+3.93 x = thousands of automatic weaponsy = murders per 100,000 residents
Q: Assume that the measurement of fineness is normally distributed with a variance of 4.0. We can state…
A:
Q: average marks obta follows Section Average marks No. of students Find combined mean. by the students…
A:
Q: Amstat News (December 2004) lists median salaries for associate professors of statistics at research…
A: Given: n 1= 200 x1 bar = $70,750 s 1= $6000. n 2 = 200 x2 bar = $65,200 s 2 = $5000.
Q: Coefficients Term Constant x1 x2 x3 Model Summary S 3.47963 Analysis of Variance Source Regression…
A: The objective is to determine whether there is multicollinearity in the model.
Q: Two types of plastic are suitable for an electronics component manufacturer to use. The breaking…
A: Given Data : For Sample 1 x̄1 = 162.5 σ1 = 1 n1 = 10 For Sample 2 x̄2 = 155…
Q: (a) x² = 14.97 (Round to two decimal places as needed.) V = 0.13 (Round to two decimal places as…
A:
Q: A crop researcher investigated the phenotypes that resulted from crossing two different types of…
A: Formula : Df = k-1
Q: 10 It is known that 15% of a large constituency voted for the Working Together Party (WTP) at the…
A: Let there are n trials and each having two outcomes - Success and Failure. The trials are…
Q: What is the class mark of the Median Class?
A: The question is about grouped frequency dist. Given :
Q: d) Estimate the interquartile range of cholesterol levels. IQR=_________mg/dL e) Above what…
A: Given that, μ=194σ=28 d) The value of first quartile is, The value of third quartile is, The…
Q: the mean cost to drive 25 miles? Use a 0.05. Hybrid cars Hybrid SUVs Hybrid trucks 2.10 2.70 1.67…
A:
Q: Suppose that the time allotted for commercials on a primetime TV program is known to have a normal…
A:
Q: The proportion p of residents in a community who recycle has traditionally been 60%. A policy maker…
A: as per our company guidelines we are able to answer only first 3 sub-parts. Kindly repost other…
Q: A consumer protection group suspects that a particular 285-gram packages of tofu actually weighs…
A:
Q: ay for patients with different categories of diagnosis. Looking at the last seven patients in each…
A: One-way ANOVA technique: Affective Disorders Cognitive Disorders Drug-related Conditions 7…
Q: del of wages and prices is presented W₁ = a₁ + a₂P₁ + α₂Q₁ + ¹₂ P = B + B₂W₁ + ß₂Y, BY + U21 Where W…
A:
Q: The table below shows the results of a survey that asked 1069 adults from a certain country if they…
A: Solution-: We have given following table: Support Oppose Unsure Total Males 157 330 12 499…
Q: 4. The following data show the health of twenty patients in a high blood pressure study: good, good,…
A: part a. Relative Frequency = Subgroup frequency/ Total frequency. Category Frequency Relative…
Q: Economics Consider the following in normal form: B S B 4,2 0,0 S 0,0 2,4 a. Is there a Nash…
A:
Q: 4. Which of the following numbers could NOT be a probability of an event (may be more than one)…
A:
Q: You generate a scatter plot using Excel. You then have Excel plot the trend line and report the…
A: The coefficient of determination is the percentage of variation in y explained by the variable x.…
Q: median salaries for associate professors of statistics at research institutions and at liberal arts…
A:
Q: Assume that X is normally distributed with a mean of 8 and a standard deviation of 3. Determine P(8…
A:
Q: A manufacturer of exercise equipment wanted to collect data on the effectiveness of their equipment…
A:
Q: 3. A manufacturer says the probability of their product being defective is 1%. If your company buys…
A:
Q: A psychologist at a private mental health facility was asked to determine whether there was a clear…
A: Given Information: Consider the given data: Affective Disorders Cognitive Disorders Drug-related…
Q: 25% of the 3rd Quarter grades in Mathematics of the Grade 10 Students is less than or equal to…
A: Given information: Class number Class Boundaries Class Interval Frequency Cumulative frequency…
Q: Ana has a team composed of ten juniors and twelve sophomores. What is the probability that a…
A: Given,no.of juniors =10no.of sophomores=12Total no.of team members=22
Q: regression over time. Does this graph suggest a specification problem? If so, outline the next…
A: Residual Plots can be understood by plotting the values on scatter plot. At each point plotted on…
Q: What proportion of the variation in y can be explained by the variation in the values of x? Report…
A: Given : X Y 43.8 54.1 41.3 51.2 35.3 60.1 48.1 44.9 42.8 51.8 44.7 50.8 39.4…
Q: What percentage of the variation in y can be explained by the variation in the values of x?
A: It is given that Correlation coefficient r = 0.13
Q: Activity1: Formulate the null and alternative hypotheses. Identify whether it is one-tailed or two…
A: Since you have posted a question with multiple sub-parts, we will solve first 3 sub-parts for you.…
Q: 4. We have the temperatures in several cities of Spain: Aviles (11°C), Barcelona (17°C), Madrid…
A: The question is based on descriptive statistics Given : The temperatures in several cities areas…
Step by step
Solved in 2 steps
- A newspaper used an estimated regression equation to describe the relationship between y = error percentage for subjects reading a four-digit liquid crystal display and the independent variables x1 = level of backlight, x2 = character subtense, x3 = viewing angle, and x4 = level of ambient light. From a table given in the article, SSRegr = 21.6, SSResid = 22, and n = 30. What is the value of the test statistic F What is the P-value What is r2 What is SeThe regression output is reported in Table 4. Why does Stata omit hhsize3? Would it make any difference if Stata omitted hhsize3 instead of hhsize1?The attached results are for a multiple regression study of smartphone addiction (SSA-SV) proneness in relation to 1) Gender 2)Age 3) Anxiety (GAD-7). I just want to clarify what the F-statistic means and the effects of AGE on the F-statistic; given that AGE is statistically significant compared to the other predictor variables.
- The new manager of an Information Technology company collected data for a sample of 20 computer programmers in the organization to perform a multiple regression analysis on the structure of their salaries. The aim of this manager in this exercise is to determine if the Salary (y) of a hired computer programmer was related to the years of Experience (??) in the organization and also the Score (??) of the programmers during their first interview aptitude test scores. The years of experience, score on the aptitude test and the corresponding annual salary (in thousands of Ghana cedis) for a sample of the 20 programmers is shown in the Regression statistics table below; Experience (??) (in years) Score (??) (out of 100%) Salary (y) (GH¢ 000) 4 78 24 7 100 43 1 86 23.7 5 82 34.3 8 86 35.8 10 84 38 0 75 22.2 1 80 23.1 6 83 30 6 91 33 9 88 38 2 73 26.6 10 75 36.2 5 81 31.6…The new manager of an Information Technology company collected data for a sample of 20 computer programmers in the organization to perform a multiple regression analysis on the structure of their salaries. The aim of this manager in this exercise is to determine if the Salary (y) of a hired computer programmer was related to the years of Experience (??) in the organization and also the Score (??) of the programmers during their first interview aptitude test scores. The years of experience, score on the aptitude test and the corresponding annual salary (in thousands of Ghana cedis) for a sample of the 20 programmers is shown in the Regression statistics table below; Experience (??) (in years) Score (??) (out of 100%) Salary (y) (GH¢ 000) 4 78 24 7 100 43 1 86 23.7 5 82 34.3 8 86 35.8 10 84 38 0 75 22.2 1 80 23.1 6 83 30 6 91 33 9 88 38 2 73 26.6 10 75 36.2 5 81 31.6…A sample of n = 120 scores were presented using the Tenacity (authority) scores to the following predictors: age gender, SES, tone of voice, and clothing. Using a two-tailed test at the 0.05 level of significance, a multiple regression analysis was computed: 1. tenacity and age (pvalue = 0.043); 2. tenacity and gender (pvalue = 0.102); 3. tenacity and SES (pvalue = 0.40); 4. tenacity and voice (pvalue = 0.001); 5. tenacity and clothing (value = 0.017); SOrs Using the pvalue, provide your DECISION, whether:Accept Ho or Reject Ho, Accept Ha
- A sample of n = 120 scores were presented using the Tenacity (authority) scores to the following predictors: age gender, SES, tone of voice, and clothing. Using a two-tailed test at the 0.05 level of significance, a multiple regression analysis was computed: 1. tenacity and age (pvalue = 0.043); 2. tenacity and gender (pvalue = 0.102); 3. tenacity and SES (pvalue = 0.40); Using the pvalue, provide your DECISION, whether: Accept Ho or Reject Ho, Accept HaThe systolic blood pressure dataset (in the third sheet of the spreadsheet linked above) contains the systolic blood pressure and age of 30 randomly selected patients in a medical facility. What is the equation for the least square regression line where the independent or predictor variable is age and the dependent or response variable is systolic blood pressure? Y=__________ X + ______________ Patient 7 is 67 years old and has a systolic blood pressure of 170 mm Hg. What is the residual? __________ mm Hg Is the actual value above, below, or on the line? What is the interpretation of the residual? (difference in actual &predicated bp, difference in age, the amount of systolic changes)A study is conducted to determine if there is a relationship between the two variables, blood haemoglobin (Hb) levels and packed cell volumes (PCV) in the female population. A simple linear regression analysis was performed using SPSS. Based on the SPSS output of the ANOVA table, which of the following statements is the CORRECT interpretation? 1. The regression model statistically significantly predicts the blood haemoglobin level. 2. About 39.98 % of variance in Hb is explained by PCV. 3. The regression model does not fit the data. 4. There is significant contribution of Hb towards PCV.
- If a scatterplot is created in excel, and a line of regression is fit along with a derived functional form, what does it mean to describe and interpret them? What conclusions would be made about relationships between two recorded variables?Suppose the following data were collected from a sample of 15 houses relating selling price to square footage and the architectural style of the house. Use statistical software to find the following regression equation: PRICEi=b0+b1SQFTi+b2COLONIALi+b3RANCHi+ei . Is there enough evidence to support the claim that on average, houses that are ranch style have lower selling prices than houses that are Victorian style at the 0.05 level of significance? If yes, write the regression equation in the spaces provided with answers rounded to two decimal places. Else, select "There is not enough evidence."Selling Price Square Footage Colonial (1 if house is Colonial style, 0 otherwise) Ranch (1 if house is Ranch style, 0 otherwise) Victorian (1 if house is Victorian style, 0 otherwise) 377640 1941 1 0 0 460996 3397 0 1 0 405781 2764 0 0 1 407216 2906 0 0 1 435139 3401 1 0 0 405275 2600 0 0 1 381141 2203 0 1 0 370490 2046 1 0 0 404070 2210 0 0 1 460196 3692 0 1 0 382780 2172 1 0 0 406466 2606 0 1…a. Can you construct a 95% confidence interval for the y intercept for the regression equation then justify the correlation between time and duration? b. Also, what are the chances of seeing a relationship between time and duration as strong or stronger than this, when in fact there was none?