25% of the 3rd Quarter grades in Mathematics of the Grade 10 Students is less than or equal to _____. (Round off your answer in nearest hundredths)
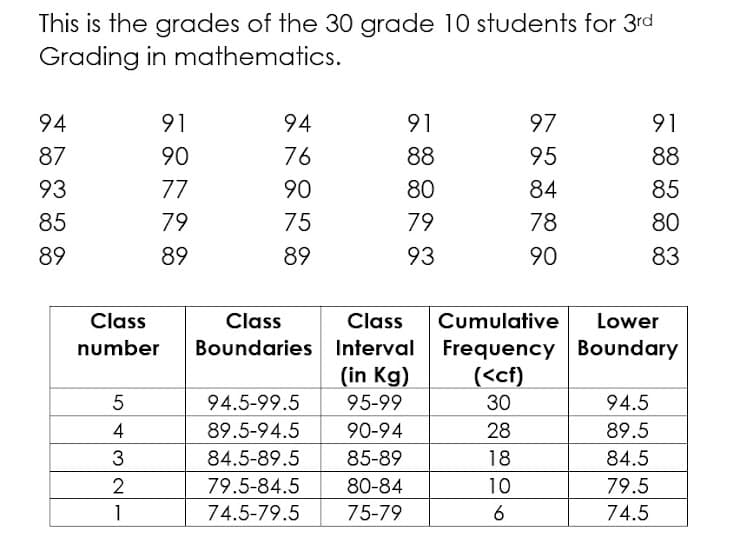
Q: Forward Selection of Terms Candidate terms: x1, x2, x3 Constant x3 x1 x2 S R-sq R-sq(adj) Mallows'…
A: We use the given output, to find the solution.
Q: What is the probability that the investment has a return of 10% or less? (2 marks). A person must…
A:
Q: The overhead reach distances of adult females are normally distributed with a mean of 205 cm and a…
A: The provided information is µ=205 cm σ=7.8 cm…
Q: Assume that X is normally distributed with a mean of 8 and a standard deviation of 3. Determine P(8…
A:
Q: ACEE, Inc. STOCK RETURN YEAR PRICE (x₁) Jan-2021 P13.56 Feb-2021 P20.80 Mar-2021 P22.50 Apr-2021…
A: Let Pi denotes the stock price at time i. Then the return (Xi) is calculated by, Return, Xi=P0P1-1…
Q: 7.18 Show that the fitted regression plan passes through the point (x1,x2,..
A: *Answer:
Q: 1. A college graduate is trying to decide whether to pursue a master's degree or not. He will only…
A: We have given that, x̄1 = 170000 s1 = 6000 n1 = 20 x̄2 = 126000 s2 = 5400…
Q: 1. X: y: Fit a straight line to the following points: 1 2 3 1 1.8 3.3 4.5 4 6-3
A:
Q: Using the Bayesian Network shown below: P(A=true) A 0.4 A P(B=true|A) true 0.2 B false 0.4 B…
A: Given the Bayesian Network as PA=true 0.4 A PB=true/A true 0.2 false 0.4 B…
Q: A marine research team records the number of fish from 3 species that they find at different depth…
A: given data
Q: Reading grade level 5 6 7 8 9 10 Number of pages 6 10 4 2 2 1 No, because the p-value is greater…
A: Given: n = 25
Q: Coefficients Term Constant x1 x2 x3 Model Summary S 3.47963 Analysis of Variance Source Regression…
A: Required: To find the estimate of variance
Q: how did you get the covariance (0.048)
A: From the information the values are given as, The formula for calculating the correlation…
Q: 5. The following data shows the time, in minutes, taken for 12 contestants to complete a task on a…
A:
Q: 1.idea or explanation for something that is based on known facts but has not yet been proven…
A: Hypothesis Testing: In this method, the researcher tests whether the assumption made in reference to…
Q: 4y +³,0 < x < 1,0 < y <1 F(x, y) = 0, elsewhere a. Verify that f(x, y) is a joint density function.…
A:
Q: Q5/ The harmonic mean of the frequency distribution is 47 70 87 45 17 33 90 57 72 65 69 35 49 40 10…
A: There are three types of mean, they are arithmetic mean, geometric mean and harmonnic mean. These…
Q: 10. A group of 20 endangered deer were moved to an island for their protection. The table on the…
A: Due to some external factors, when the growth of a population (i.e., the deer population in this…
Q: (a) x² = 14.97 (Round to two decimal places as needed.) V = 0.13 (Round to two decimal places as…
A:
Q: 10 It is known that 15% of a large constituency voted for the Working Together Party (WTP) at the…
A: Let there are n trials and each having two outcomes - Success and Failure. The trials are…
Q: Diabetes Improving control of blood-glucose levels is an important motivation for the use of insulin…
A:
Q: (b) Find the expected value and variance of the number of drinks. E(Y) = 1.55 Var(Y) = 2.85 (Type…
A: Given: X 1 Sandwich 2 Sandwich Y 1 drink 0.35 0.2 2 drinks 0.1 0.25 3 drinks 0…
Q: A random sample of 50 bags of white Cheddar popcorn weighed, on average, 5.35 ounces with a standard…
A:
Q: A set of data has a normal distribution with a mean of 100 and a standard deviation of 15. Find the…
A:
Q: Using StatCrunch, determine the z-score such that the area under the standard normal density curve…
A: Given information- We have given the area under the standard normal density curve to its right as…
Q: Regression a)Compare the three models below: Model 1: train MSE = 0.423, test MSE = 0.978 Model…
A:
Q: 1. (a) Let X be a continuous, non-negative (that is, P(X ≥ 0) = 1) random variable with PDF f. Show…
A:
Q: Scenario 4: Drug Effectiveness To test the effectiveness of a new drug, a researcher gives one group…
A:
Q: Using the Cp criterion, which variables is/are included in the best set of the model? a. x1 b. x2…
A:
Q: It is tested by a statistical test. a. Null hypothesis b. Alternative hypothesis c. Test statistic…
A: Given that
Q: Question 5 Suppose we have the PRF represented as the equation In Y₁ = b + b, ln X₁, + b₂ ln X₂, +…
A:
Q: Glaucoma is a leading cause of blindness in the United States, N. Ehlers measured the difference in…
A: Introduction: The output of a paired t-test is given.
Q: We throw a dice 10 times consecutively, obtaining the results: 1, 1, 1, 3, 3, 4, 4, 5, 6, 6.…
A: Solution
Q: A result is called "statistically significant" whenever A The p-value is less or equal to the…
A:
Q: Consider a binomial distribution. About 33% of math students attend a Math Lab during the semester.…
A:
Q: 3. A study of beer consumption using the annual data from 1980 -2001 produced the following…
A: Since you have posted a question with multiple subparts, we will solve first 3 sub-parts for you…
Q: The second game (shown below) is a repeated game. It represents their behavior in two successive…
A:
Q: 1.Which is the alternative hypothesis? a. There is a significant difference between a person's age…
A:
Q: assume that you plan to use a significance level of. 05 to test the claim that P one equals P2 used…
A: From the given information we conduct the Hypothesis test for Proportion. We get one example for…
Q: Construct a Venn diagram illustrating the sets below. U={1, 2, 3, 4, 5, 6, 7, 8, 9) Y=(3,7,8,9)…
A: As per company guidelines I solved only First questions.thank you
Q: A random sample of 50 bags of white Cheddar popcorn weighed, on average, 5.35 ounces with a standard…
A:
Q: 1. A poor, primarily Republican county, located in the Midwest, with a mean educational level of 13…
A: Since, no question number is specified for answering, we'll be answering the first question only.…
Q: 15. Suppose a fast-food restaurant can expect 6 customers every 9 minutes, on average. a) What is…
A:
Q: Using the Bayesian Network shown below: P(A=true) A 0.4 A P(B=true|A) true 0.2 B false 0.4 B…
A: For the given Bayesian Network, we need to find the conditional probability: P(A=false | B=true,…
Q: 4. The table shows the number C of cars in an office parking lot over the course of a work day. The…
A:
Q: JB: =1 if a majority of registered voters in county are Republicans, o otherwise; C: = mean number…
A:
Q: Glaucoma is a leading cause of blindness in the United States, N. Ehlers measured the difference in…
A: Researchers use the APA style reporting of test while publishing their study in journals.
Q: If population standard deviation is known and n>30 then appropriate test statistics mean comparison…
A: According to the given information in this question There are two questions according to bartleby…
Q: 3. An experiment was performed to compare the abrasive wear of two different laminated materials.…
A: The question is based on a hypo. testing Given : Total no. of pieces of material 1 ( n1 ) = 12…
Q: 2. What is the probability of getting three cards of the same suit when dealt 3 cards from a…
A: 2. There are three cards are selected from standard deck. The possible outcome is (352) There are…
Trending now
This is a popular solution!
Step by step
Solved in 2 steps
- Is the number of games won by a major league baseball team in a season related to the team batting average? The table below shows the number of games won and the batting average (in thousandths) of 8 teams. Team Games Won Batting Average 1 6060 259259 2 120120 277277 3 8989 263263 4 101101 288288 5 8585 287287 6 109109 270270 7 7777 272272 8 106106 290290 Using games won as the explanatory variable xx, do the following: (a) The correlation coefficient is r=r= . (b) The equation of the least squares line is y^=y^= . SpeakIs the number of games won by a major league baseball team in a season related to the team batting average? The table below shows the number of games won and the batting average (in thousandths) of 8 teams. Team Games Won Batting Average 1 8383 289289 2 116116 290290 3 101101 287287 4 8181 262262 5 110110 288288 6 119119 269269 7 6060 268268 8 6161 280280 Using games won as the explanatory variable xx, do the following: (a) The correlation coefficient is r=r= . (b) The equation of the least squares line is y^=y^=Is the number of games won by a major league baseball team in a season related to the team batting average? The table below shows the number of games won and the batting average (in thousandths) of 8 teams. Team Games Won Batting Average 1 9797 269269 2 9595 275275 3 8686 273273 4 9999 261261 5 6464 285285 6 118118 260260 7 8787 274274 8 8888 280280 Using games won as the explanatory variable ?x, compute the correlation coefficient
- The following data represent the monthly phone use, in minutes, of a customer enrolled in a fraud prevention program for the past 20 months. The phone company decides to use the upper fence as the cutoff point for the number of minutes at which the customer should be contacted. What is the cutoff point? 510398398515357327480491308408483394320338463321374307538409The following data has been collected on the interarrival times of patients to an emergency department: 3.772, 1.761, 0.743, 15.988, 0.412, 7.541, 6.900, 3.447, 7.024, 1.061, 5.449, 0.309, 0.766, 4.807, 8.143, 0.093, 9.524, 0.012, 4.634, and 0.195 minutes. Estimate the squared coefficient of variation of the arrival process. Is the arrival process likely to be Poisson? Why or why not? Estimate the arrival rate?Data collected by a price reporting agency from more than 90,000 gasoline and convenience stores throughout the U.S. showed that the average price for a liter of unleaded gasoline was $0.87. The following data show the price per liter ($) for a sample of 20 gasoline and convenience stores located in San Francisco. 0.97 0.97 1.29 0.92 0.96 0.96 0.98 0.93 1.01 0.96 0.96 0.97 0.96 1.03 1.12 0.95 0.94 1.01 0.93 0.92 (a) Use the sample data to estimate the mean price in dollars for a liter of unleaded gasoline in San Francisco. (Round your answer to three decimal places.) (b) Compute the sample standard deviation in dollars. (Round your answer to three decimal places.) (c) Compare the mean price per liter for the sample data to the national average price. What conclusions can you draw about the cost of living in San Francisco? The average price for a liter of unleaded gasoline in San Francisco is lower than/higher than/same as the national average. This indicates…
- Data collected by a price reporting agency from more than 90,000 gasoline and convenience stores throughout the U.S. showed that the average price for a liter of unleaded gasoline was $0.87. The following data show the price per liter ($) for a sample of 20 gasoline and convenience stores located in San Francisco. 0.97 0.97 1.25 0.92 0.92 1.00 0.94 0.97 1.01 0.96 0.96 0.97 0.92 1.03 1.12 0.95 0.98 0.97 0.97 0.96 (a) Use the sample data to estimate the mean price in dollars for a liter of unleaded gasoline in San Francisco. (Round your answer to three decimal places.) $ (b) Compute the sample standard deviation in dollars. (Round your answer to three decimal places.) $ (c) Compare the mean price per liter for the sample data to the national average price. What conclusions can you draw about the cost of living in San Francisco? The average price for a liter of unleaded gasoline in San Francisco is the national average. This indicates that the cost of living in San…A(n) _______ uses line segments to connect points located directly above class midpoint values.The data below shows car model and the color of vehicles sold at a Car dealership.Hyundai Honda Toyota Daihatsu Subaru TotalRed 2015.40118.648613.518*54.5950Black 1516.9569.511814.8698.6275.0555White 2224.651513.842621.621212.5457.35**Total 57 32 50 29 17 185Chi Sq =1.37 + 0.64 + 4.18 + 0.00 + 0.04 +0.22 + 1.30 + *** + 0.02 + 0.75 +0.28 + 0.10 + 0.89 + 0.02 + 0.75 = 10.47DF = ****, P-Value = *****No cells with expected counts less than 5a) Carefully define the null and alternative hypotheses of the χ2 test underlying the generation of the above table.
- The data below shows car model and the color of vehicles sold at a Car dealership.Hyundai Honda Toyota Daihatsu Subaru TotalRed 2015.40118.648613.518*54.5950Black 1516.9569.511814.8698.6275.0555White 2224.651513.842621.621212.5457.35**Total 57 32 50 29 17 185Chi Sq =1.37 + 0.64 + 4.18 + 0.00 + 0.04 +0.22 + 1.30 + *** + 0.02 + 0.75 +0.28 + 0.10 + 0.89 + 0.02 + 0.75 = 10.47DF = ****, P-Value = *****No cells with expected counts less than 5a) Carefully define the null and alternative hypotheses of the χ2 test underlying thegeneration of the above table.b) Fill in the missing values ‘*’, ‘**’, ‘***’, ‘****’ and ‘*****’.c) What is the conclusion of this test at the 5% level of significance? Give reasons for youranswer.d) Name two limitations of this test.The data below shows car model and the color of vehicles sold at a Car dealership.Hyundai Honda Toyota Daihatsu Subaru TotalRed 2015.40118.648613.518*54.5950Black 1516.9569.511814.8698.6275.0555White 2224.651513.842621.621212.5457.35**Total 57 32 50 29 17 185Chi Sq =1.37 + 0.64 + 4.18 + 0.00 + 0.04 +0.22 + 1.30 + *** + 0.02 + 0.75 +0.28 + 0.10 + 0.89 + 0.02 + 0.75 = 10.47DF = ****, P-Value = *****No cells with expected counts less than 5 b) Fill in the missing values ‘*’, ‘**’, ‘***’, ‘****’ and ‘*****’. c) What is the conclusion of this test at the 5% level of significance? Give reasons for your answer. d) Name two limitations of this testThe following are the drying times (minutes) of 100sheets coated with polyurethane under various ambientconditions:45.6 50.3 55.1 63.0 58.2 65.5 51.1 57.4 60.4 54.956.1 62.1 43.5 63.8 64.9 59.9 63.0 67.7 53.8 57.961.8 52.2 61.2 51.6 58.6 73.8 53.9 64.1 57.2 75.455.9 70.1 46.2 63.6 56.0 48.1 62.2 58.8 50.8 68.151.4 73.9 66.7 42.9 71.0 56.1 60.8 58.6 70.6 62.259.9 47.5 72.5 62.0 56.8 54.3 61.0 66.3 52.6 63.564.3 63.6 53.5 55.1 62.8 63.3 64.7 54.9 54.4 69.664.2 59.3 60.6 57.1 68.3 46.7 73.7 56.8 62.9 58.468.5 68.9 62.1 62.8 74.4 43.8 40.0 64.4 50.8 49.955.8 66.8 67.0 64.8 57.6 68.3 42.5 64.4 48.3 56.5Construct a frequency distribution of these data, usingeight classes.