Given the estimated model above, for every additional cigarette smoked while pregnant, the associated change in birth weight is
Given the estimated model above, for every additional cigarette smoked while pregnant, the associated change in birth weight is

Functions and Change: A Modeling Approach to College Algebra (MindTap Course List)
6th Edition
ISBN:9781337111348
Author:Bruce Crauder, Benny Evans, Alan Noell
Publisher:Bruce Crauder, Benny Evans, Alan Noell
Chapter5: A Survey Of Other Common Functions
Section5.6: Higher-degree Polynomials And Rational Functions
Problem 1TU: The following fictitious table shows kryptonite price, in dollar per gram, t years after 2006. t=...

Related questions
Question
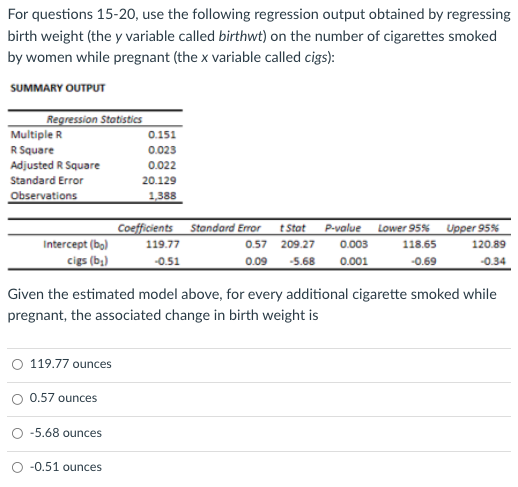
Transcribed Image Text:For questions 15-20, use the following regression output obtained by regressing
birth weight (the y variable called birthwt) on the number of cigarettes smoked
by women while pregnant (the x variable called cigs):
SUMMARY OUTPUT
Regression Stotistics
Multiple R
0.151
R Square
0.023
Adjusted R Square
0.022
Standard Error
20.129
Observations
1,388
Coefficients Standard Error tStat P-value Lower 95% Upper 95%
Intercept (bo)
119.77
0.57
209.27
0.003
118.65
120.89
cigs (b;)
0.09 -5.68
-0.34
-0.51
0.001
-0.69
Given the estimated model above, for every additional cigarette smoked while
pregnant, the associated change in birth weight is
O 119.77 ounces
0.57 ounces
-5.68 ounces
O -0.51 ounces
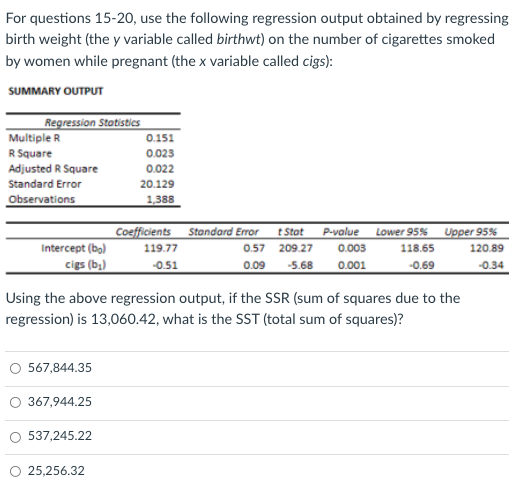
Transcribed Image Text:For questions 15-20, use the following regression output obtained by regressing
birth weight (the y variable called birthwt) on the number of cigarettes smoked
by women while pregnant (the x variable called cigs):
SUMMARY OUTPUT
Regression Statistics
Multiple R
0.151
R Square
0.023
Adjusted R Square
0.022
Standard Error
20.129
Observations
1,388
Coefficients Standard Error
t Stat
P-value
Lower 95%
Upper 95%
Intercept (bo)
119.77
0.57
209.27
0.003
118.65
120.89
cigs (b;)
-0.51
0.09
-5.68
0.001
-0.69
-0.34
Using the above regression output, if the SSR (sum of squares due to the
regression) is 13,060.42, what is the SST (total sum of squares)?
567,844.35
367,944.25
537,245.22
O 25,256.32
Expert Solution
This question has been solved!
Explore an expertly crafted, step-by-step solution for a thorough understanding of key concepts.

This is a popular solution!

Trending now
This is a popular solution!

Step by step
Solved in 3 steps

Recommended textbooks for you
Functions and Change: A Modeling Approach to Coll…
Algebra
ISBN:
9781337111348
Author:
Bruce Crauder, Benny Evans, Alan Noell
Publisher:
Cengage Learning


Algebra & Trigonometry with Analytic Geometry
Algebra
ISBN:
9781133382119
Author:
Swokowski
Publisher:
Cengage
Functions and Change: A Modeling Approach to Coll…
Algebra
ISBN:
9781337111348
Author:
Bruce Crauder, Benny Evans, Alan Noell
Publisher:
Cengage Learning
Algebra & Trigonometry with Analytic Geometry
Algebra
ISBN:
9781133382119
Author:
Swokowski
Publisher:
Cengage

College Algebra
Algebra
ISBN:
9781305115545
Author:
James Stewart, Lothar Redlin, Saleem Watson
Publisher:
Cengage Learning

Algebra and Trigonometry (MindTap Course List)
Algebra
ISBN:
9781305071742
Author:
James Stewart, Lothar Redlin, Saleem Watson
Publisher:
Cengage Learning