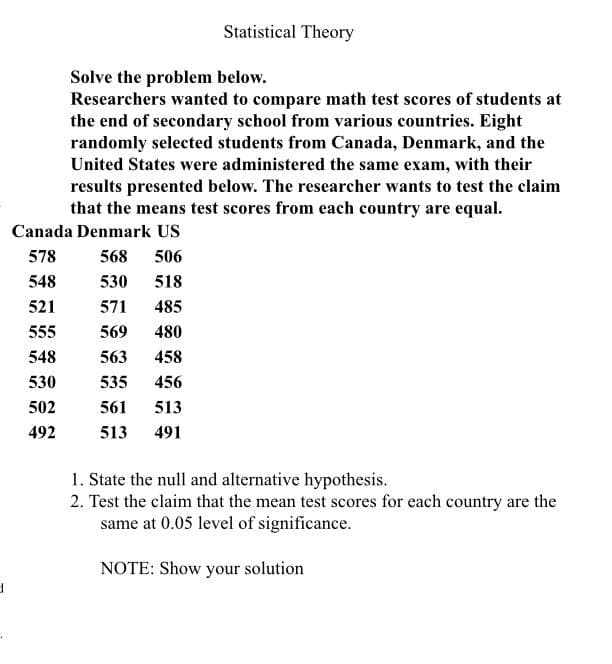
d Statistical Theory Solve the problem below. Researchers wanted to compare math test scores of students at the end of secondary school from various countries. Eight randomly selected students from Canada, Denmark, and the United States were administered the same exam, with their results presented below. The researcher wants to test the claim that the means test scores from each country are equal. Canada Denmark US 578 568 506 548 530 518 521 571 485 555 569 480 548 563 458 530 535 456 502 561 513 492 513 491 1. State the null and alternative hypothesis. 2. Test the claim that the mean test scores for each country are the same at 0.05 level of significance. NOTE: Show your solution
d Statistical Theory Solve the problem below. Researchers wanted to compare math test scores of students at the end of secondary school from various countries. Eight randomly selected students from Canada, Denmark, and the United States were administered the same exam, with their results presented below. The researcher wants to test the claim that the means test scores from each country are equal. Canada Denmark US 578 568 506 548 530 518 521 571 485 555 569 480 548 563 458 530 535 456 502 561 513 492 513 491 1. State the null and alternative hypothesis. 2. Test the claim that the mean test scores for each country are the same at 0.05 level of significance. NOTE: Show your solution

Holt Mcdougal Larson Pre-algebra: Student Edition 2012
1st Edition
ISBN:9780547587776
Author:HOLT MCDOUGAL
Publisher:HOLT MCDOUGAL
Chapter11: Data Analysis And Probability
Section11.5: Interpreting Data
Problem 9E

Related questions
Question
Transcribed Image Text:d
Statistical Theory
Solve the problem below.
Researchers wanted to compare math test scores of students at
the end of secondary school from various countries. Eight
randomly selected students from Canada, Denmark, and the
United States were administered the same exam, with their
results presented below. The researcher wants to test the claim
that the means test scores from each country are equal.
Canada Denmark US
578
568 506
548
530 518
521
571 485
555
569
480
548
563 458
530
535
456
502
561 513
492
513
491
1. State the null and alternative hypothesis.
2. Test the claim that the mean test scores for each country are the
same at 0.05 level of significance.
NOTE: Show your solution
Expert Solution
This question has been solved!
Explore an expertly crafted, step-by-step solution for a thorough understanding of key concepts.

Step by step
Solved in 2 steps with 2 images

Recommended textbooks for you
Holt Mcdougal Larson Pre-algebra: Student Edition…
Algebra
ISBN:
9780547587776
Author:
HOLT MCDOUGAL
Publisher:
HOLT MCDOUGAL

Glencoe Algebra 1, Student Edition, 9780079039897…
Algebra
ISBN:
9780079039897
Author:
Carter
Publisher:
McGraw Hill

Big Ideas Math A Bridge To Success Algebra 1: Stu…
Algebra
ISBN:
9781680331141
Author:
HOUGHTON MIFFLIN HARCOURT
Publisher:
Houghton Mifflin Harcourt
Holt Mcdougal Larson Pre-algebra: Student Edition…
Algebra
ISBN:
9780547587776
Author:
HOLT MCDOUGAL
Publisher:
HOLT MCDOUGAL
Glencoe Algebra 1, Student Edition, 9780079039897…
Algebra
ISBN:
9780079039897
Author:
Carter
Publisher:
McGraw Hill
Big Ideas Math A Bridge To Success Algebra 1: Stu…
Algebra
ISBN:
9781680331141
Author:
HOUGHTON MIFFLIN HARCOURT
Publisher:
Houghton Mifflin Harcourt