d) Using this portion of the standard normal chart and part (c), find the probability P(x 2 60). 00 .01 .02 .03 .04 .05 9678 .9744 .9798 1.8 .9641 .9713 9772 9649 1.9 2.0 9719 9778 .9656 .9726 9783 9664 .9732 9788 9671 9738 9793 e) You should have found that the answer to (d) is much smaller than the answer to (b). This means that the probability of getting 60% or more tails depends on the sample size n. That is: Probability of 6 or more tails out of 10> Probability of 60 or more tails out of 100 even though the proportion, p = 60%, is the same in both cases. Why does this happen? %3D ive e You Allyou in f) Without doing any new calculations, resolve these two hypothesis tests to a 3% level of significance. The null hypothesis is that the coin is fair. The alternate hypothesis is that the coin is biased toward tails. Ho:p = 0.5 H:p > 0.5 %3D I. If the coin is flipped 10 times and it comes up tails 6 times, what is your conclusion? Compare your result from part (b) to the cutoff of 3%. II. If the coin is flipped 100 times and it comes up tails 60 times, what is your conclusion? Compare your result from part (d) to the cutoff of 3%.
d) Using this portion of the standard normal chart and part (c), find the probability P(x 2 60). 00 .01 .02 .03 .04 .05 9678 .9744 .9798 1.8 .9641 .9713 9772 9649 1.9 2.0 9719 9778 .9656 .9726 9783 9664 .9732 9788 9671 9738 9793 e) You should have found that the answer to (d) is much smaller than the answer to (b). This means that the probability of getting 60% or more tails depends on the sample size n. That is: Probability of 6 or more tails out of 10> Probability of 60 or more tails out of 100 even though the proportion, p = 60%, is the same in both cases. Why does this happen? %3D ive e You Allyou in f) Without doing any new calculations, resolve these two hypothesis tests to a 3% level of significance. The null hypothesis is that the coin is fair. The alternate hypothesis is that the coin is biased toward tails. Ho:p = 0.5 H:p > 0.5 %3D I. If the coin is flipped 10 times and it comes up tails 6 times, what is your conclusion? Compare your result from part (b) to the cutoff of 3%. II. If the coin is flipped 100 times and it comes up tails 60 times, what is your conclusion? Compare your result from part (d) to the cutoff of 3%.

Glencoe Algebra 1, Student Edition, 9780079039897, 0079039898, 2018
18th Edition
ISBN:9780079039897
Author:Carter
Publisher:Carter
Chapter10: Statistics
Section10.4: Distributions Of Data
Problem 19PFA

Related questions
Question
please only answer D, E and F!!! ONLY D, E AND F!!
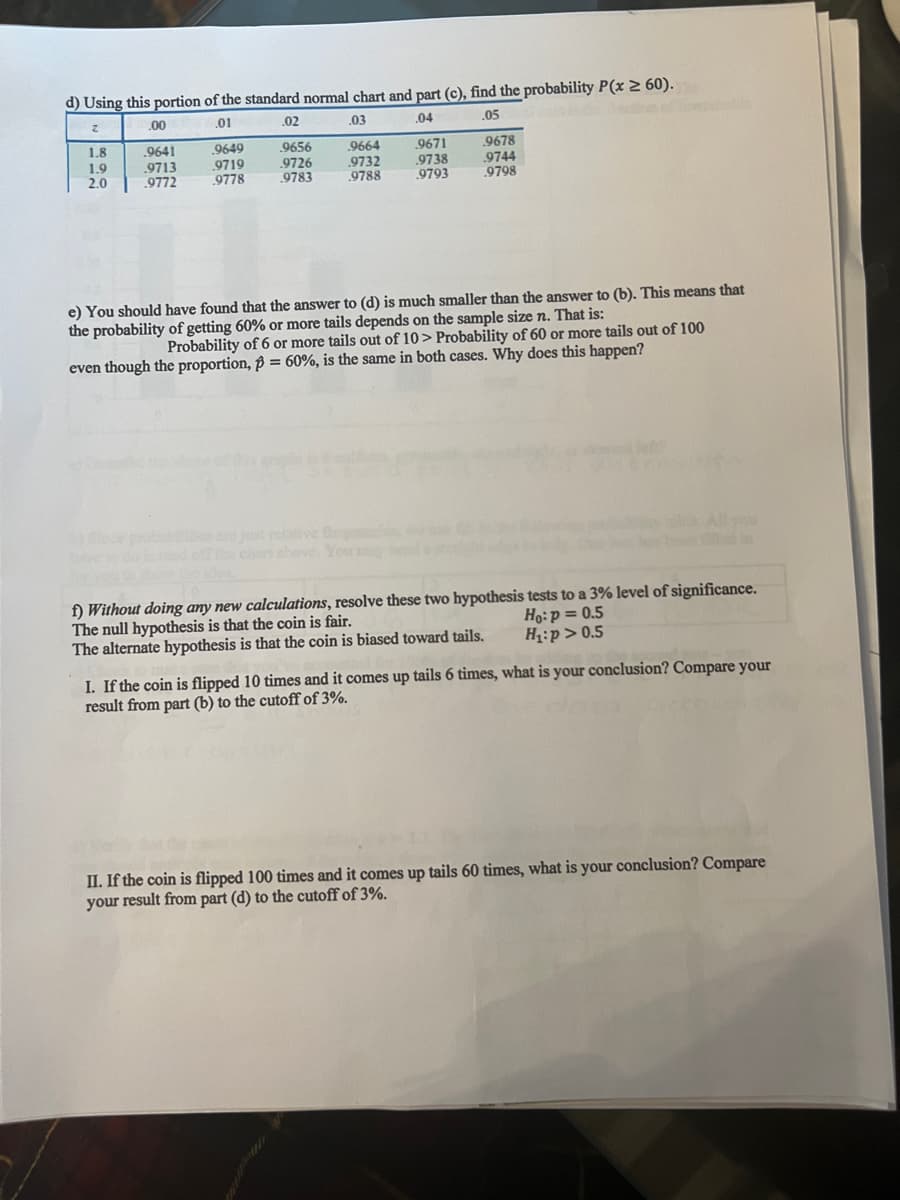
Transcribed Image Text:d) Using this portion of the standard normal chart and part (c), find the probability P(x 2 60).
.00
.01
.02
2
.03
.04
.05
9656
.9726
9783
9671
.9738
.9793
1.8
.9641
9678
1.9
2.0
.9713
.9772
.9649
.9719
.9778
9664
9732
9788
.9744
.9798
e) You should have found that the answer to (d) is much smaller than the answer to (b). This means that
the probability of getting 60% or more tails depends on the sample size n. That is:
Probability of 6 or more tails out of 10> Probability of 60 or more tails out of 100
even though the proportion, p = 60%, is the same in both cases. Why does this happen?
%3D
strelive fe
chan shove Yo
All you
d in
f) Without doing any new calculations, resolve these two hypothesis tests to a 3% level of significance.
The null hypothesis is that the coin is fair.
The alternate hypothesis is that the coin is biased toward tails.
Họ:p = 0.5
H:p> 0.5
I. If the coin is flipped 10 times and it comes up tails 6 times, what is your conclusion? Compare your
result from part (b) to the cutoff of 3%.
II. If the coin is flipped 100 times and it comes up tails 60 times, what is your conclusion? Compare
your result from part (d) to the cutoff of 3%.
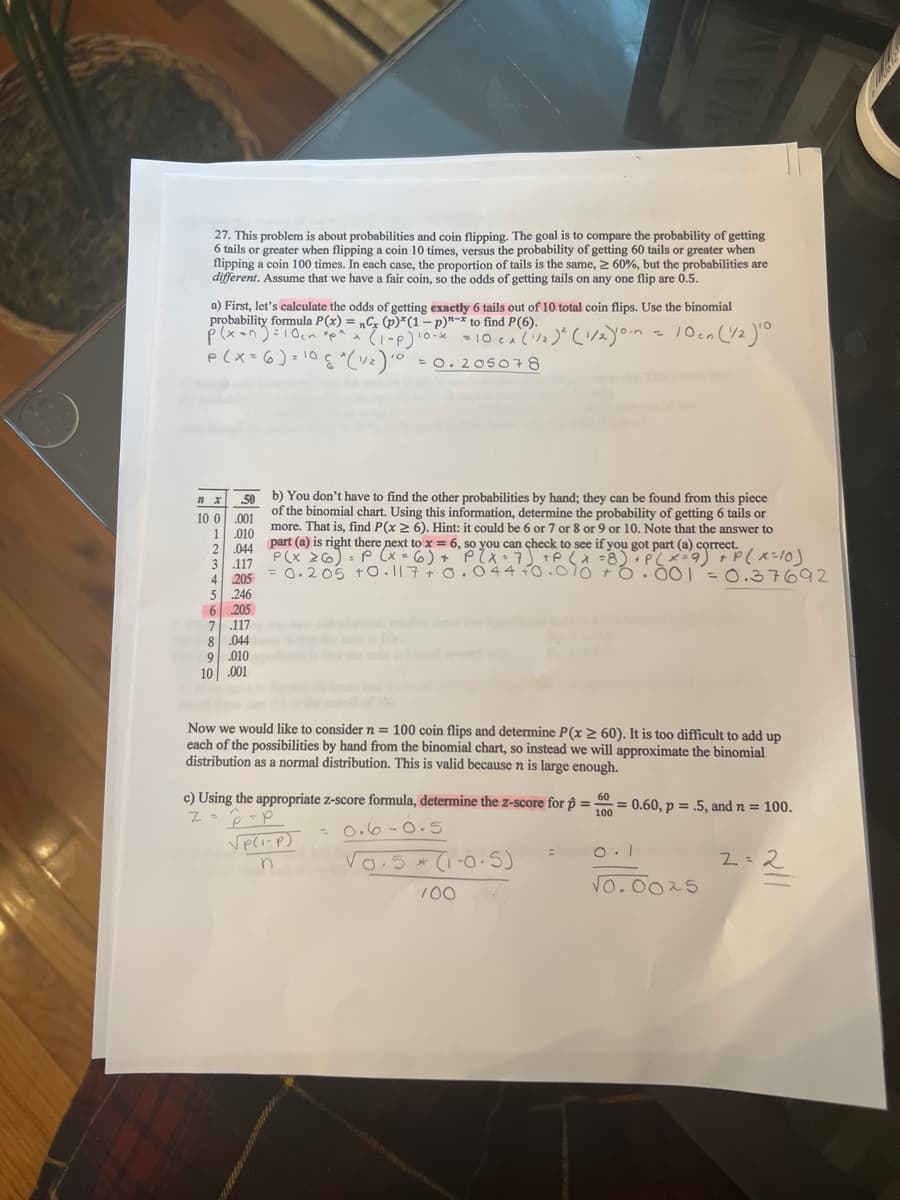
Transcribed Image Text:27. This problem is about probabilities and coin flipping. The goal is to compare the probability of getting
tails or greater when flipping a coin 10 times, versus the probability of getting 60 tails or greater when
flipping a coin 100 times. In each case, the proportion of tails is the same, 2 60%, but the probabilities are
different. Assume that we have a fair coin, so the odds of getting tails on any one flip are 0.5.
a) First, let's calculate the odds of getting exactly 6 tails out of 10 total coin flips. Use the binomial
probability formula P(x) = „Cz (p)*(1-p)"-* to find P(6).
%3D
CA
p(X=6)=10
= 0. 205078
b) You don't have to find the other probabilities by hand; they can be found from this piece
10 0.001
1.010
2.044
3 .117
4 205
5 246
205
50
of the binomial chart. Using this information, determine the probability of getting 6 tails or
more. That is, find P(x 2 6). Hint: it could be 6 or 7 or 8 or 9 or 10. Note that the answer to
part (a) is right there next to x = 6, so you can check to see if you got part (a) correct.
P(X 26): P (x 6) + PlX=7) TP (x =8)*P(x=9) +P(x-lo)
= 0.205 t0.117+0. 044+0.07o Fo.00 =0.37692
%3D
6
7 .117
8.044
9.010
10 .001
Now we would like to consider n = 100 coin flips and determine P(x 2 60). It is too difficult to add up
each of the possibilities by hand from the binomial chart, so instead we will approximate the binomial
distribution as a normal distribution. This is valid because n is large enough.
c) Using the appropriate z-score formula, determine the z-score for ôộ =
60
= 0.60, p = .5, and n = 100.
100
- o.6-0.5
Vo.5 *
(i-0.5)
2=2
Vo.0025
100
Expert Solution
This question has been solved!
Explore an expertly crafted, step-by-step solution for a thorough understanding of key concepts.

Step by step
Solved in 5 steps

Recommended textbooks for you
Glencoe Algebra 1, Student Edition, 9780079039897…
Algebra
ISBN:
9780079039897
Author:
Carter
Publisher:
McGraw Hill
Glencoe Algebra 1, Student Edition, 9780079039897…
Algebra
ISBN:
9780079039897
Author:
Carter
Publisher:
McGraw Hill