d. A point estimate of the average difference in the creatinine level (in micromoles per litre) of each specimen using each machine is e. At 5% level of significance, test if there is difference in the measured creatinine level (in micromoles per litre) of each specimen using each machine.
d. A point estimate of the average difference in the creatinine level (in micromoles per litre) of each specimen using each machine is e. At 5% level of significance, test if there is difference in the measured creatinine level (in micromoles per litre) of each specimen using each machine.

MATLAB: An Introduction with Applications
6th Edition
ISBN:9781119256830
Author:Amos Gilat
Publisher:Amos Gilat
Chapter1: Starting With Matlab
Section: Chapter Questions
Problem 1P

Related questions
Question
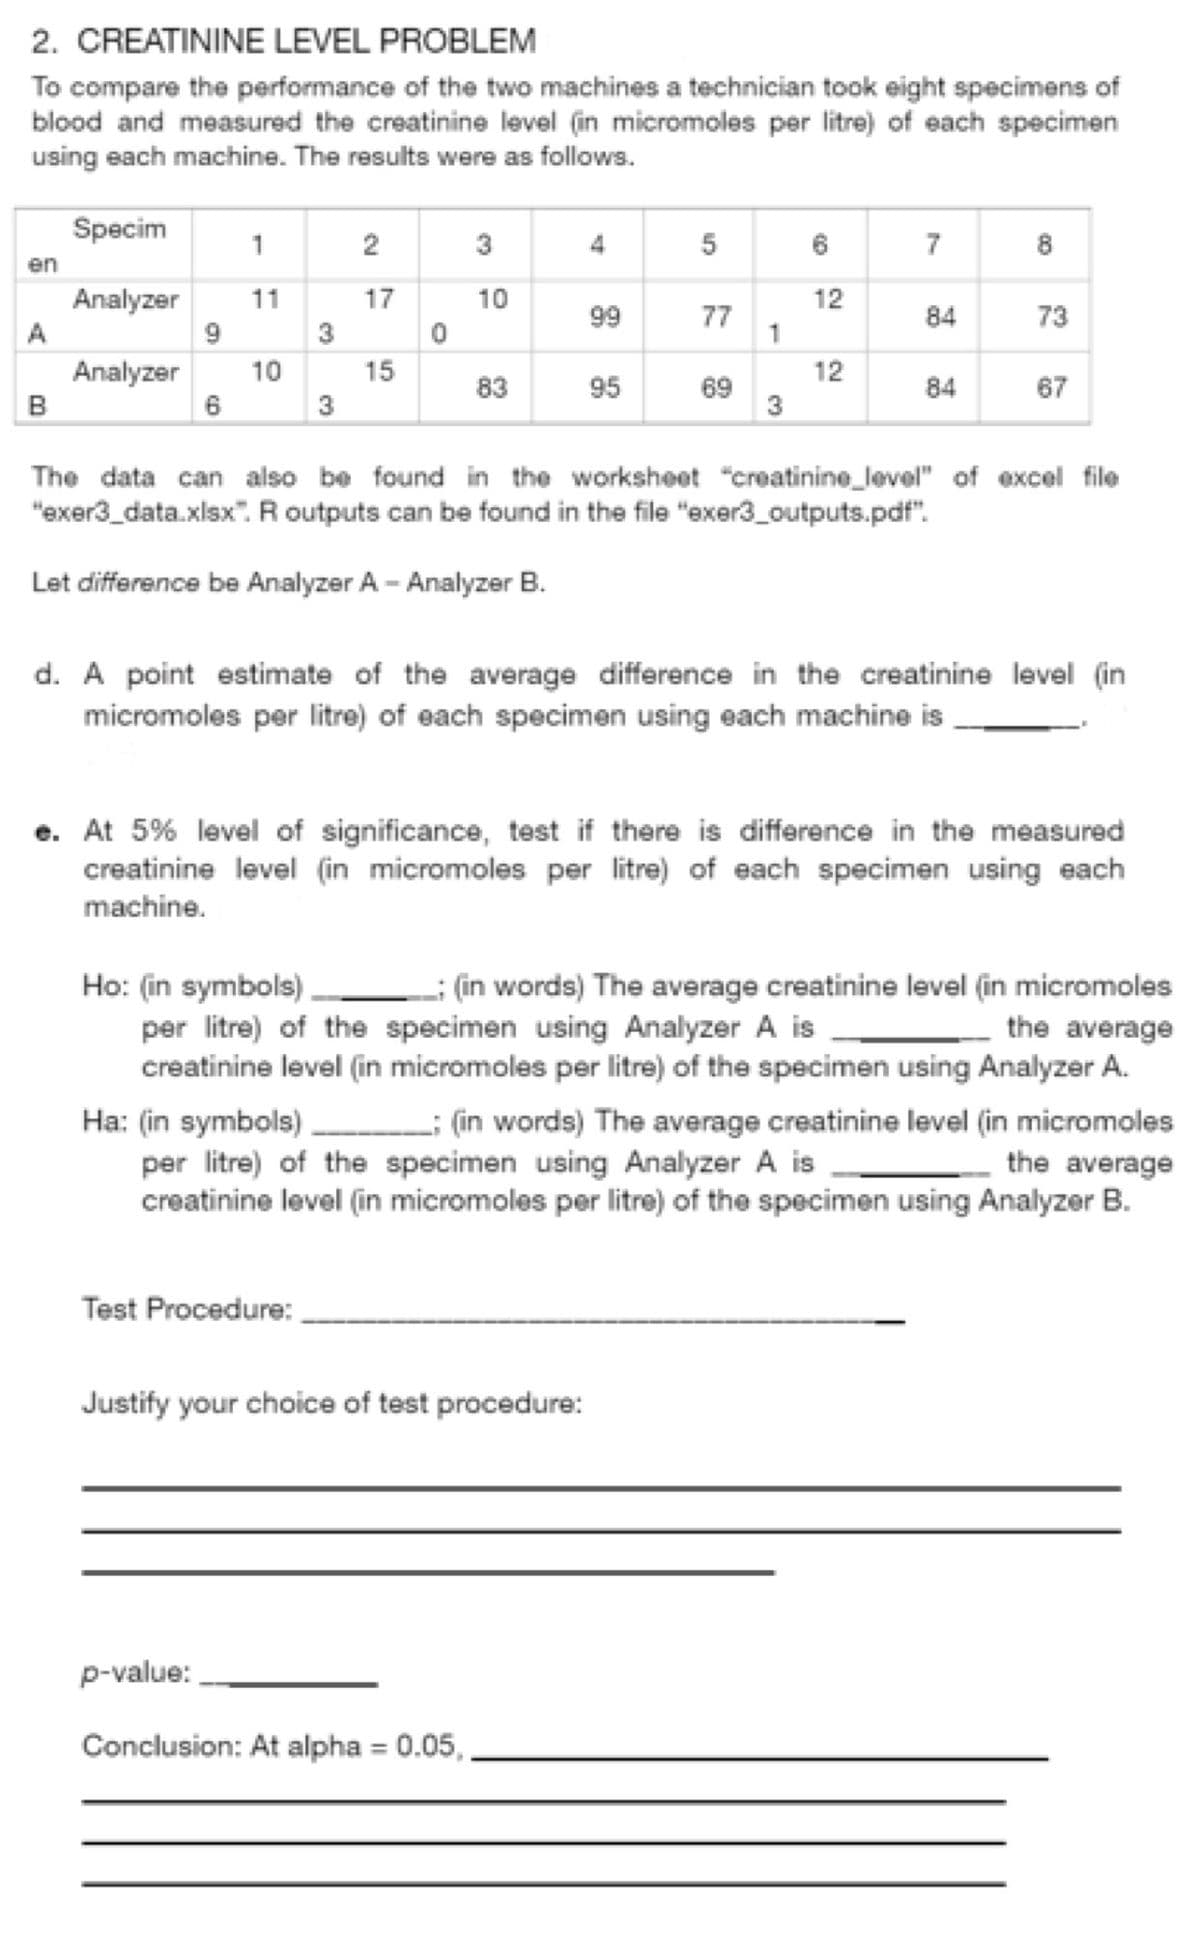
Transcribed Image Text:2. CREATININE LEVEL PROBLEM
To compare the performance of the two machines a technician took eight specimens of
blood and measured the creatinine level (in micromoles per litre) of each specimen
using each machine. The results were as follows.
Specim
Analyzer
Analyzer 10
en
A
B
9
6
1
11
3
3
نيا
ev
2
Test Procedure:
17
15
0
30
10
83
4
99
p-value:
Conclusion: At alpha= 0.05,
95
5
Justify your choice of test procedure:
77
69
1
3
6
12
12
7
84
84
8
The data can also be found in the worksheet "creatinine_level" of excel file
"exer3_data.xlsx". R outputs can be found in the file "exer3_outputs.pdf".
Let difference be Analyzer A-Analyzer B.
73
d. A point estimate of the average difference in the creatinine level (in
micromoles per litre) of each specimen using each machine is
67
e. At 5% level of significance, test if there is difference in the measured
creatinine level (in micromoles per litre) of each specimen using each
machine.
Ho: (in symbols): (in words) The average creatinine level (in micromoles
per litre) of the specimen using Analyzer A is
the average
creatinine level (in micromoles per litre) of the specimen using Analyzer A.
Ha: (in symbols)___________ (in words) The average creatinine level (in micromoles
per litre) of the specimen using Analyzer A is
the average
creatinine level (in micromoles per litre) of the specimen using Analyzer B.
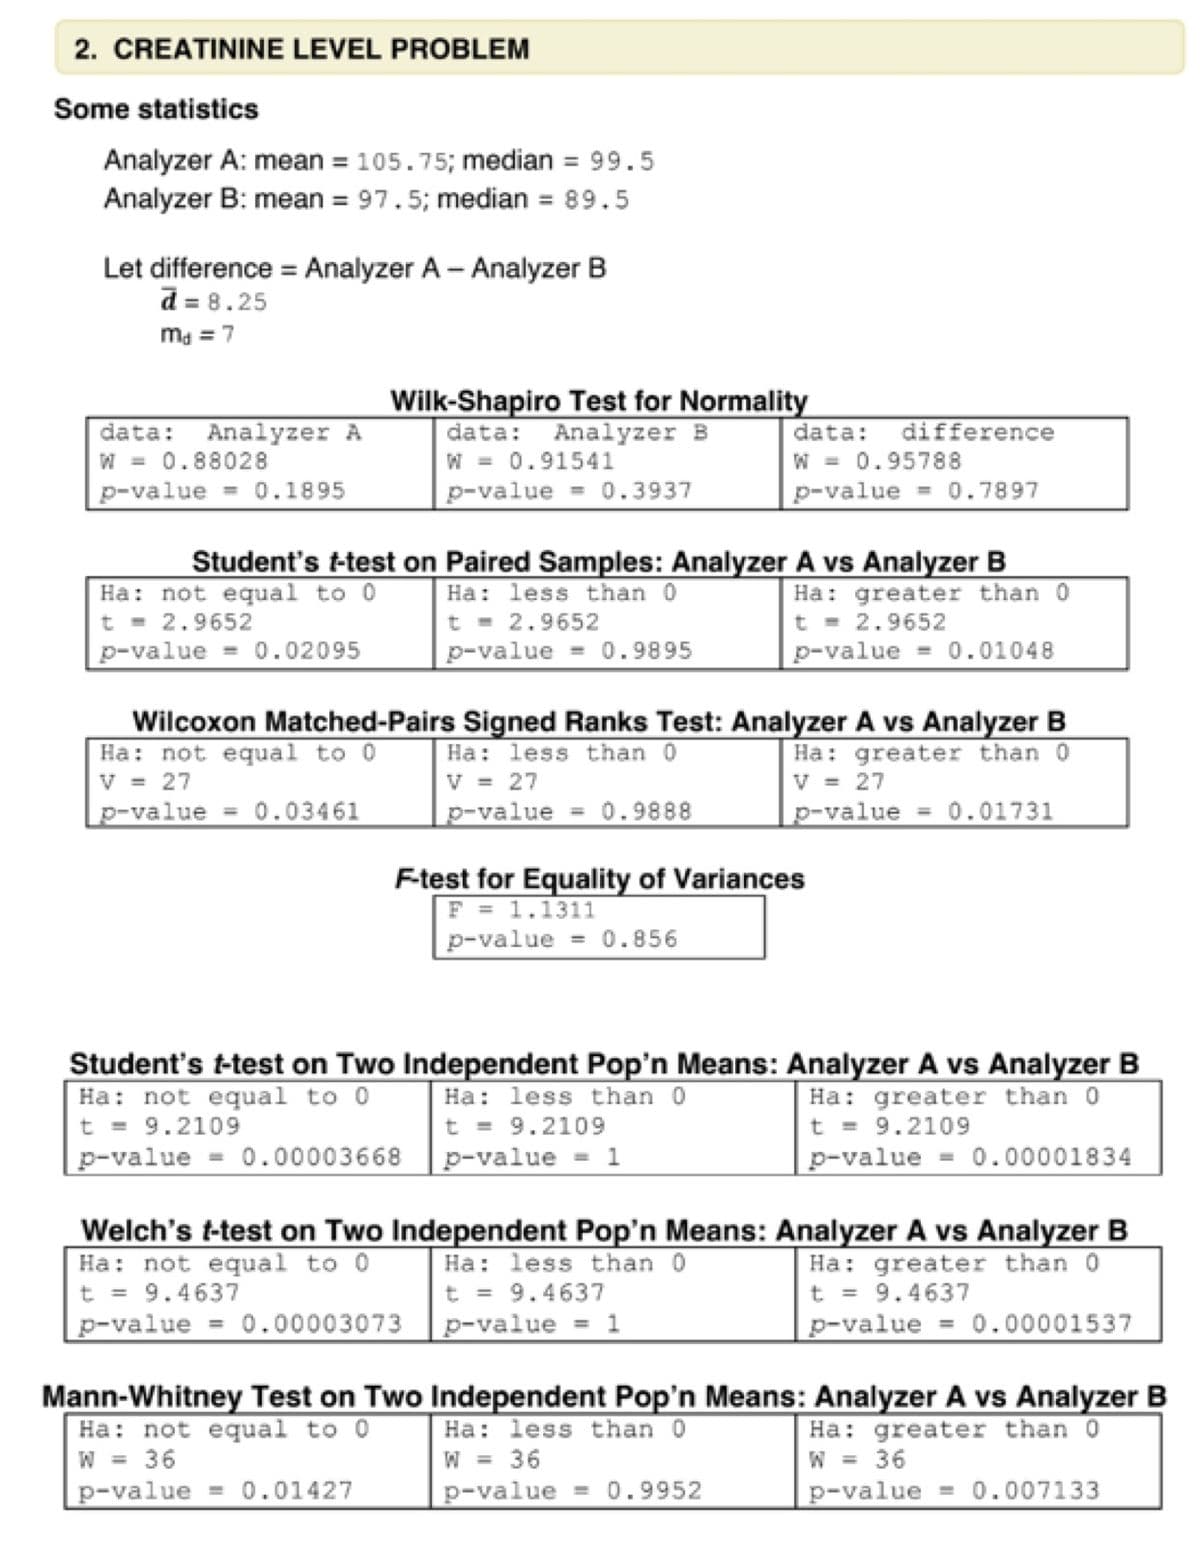
Transcribed Image Text:2. CREATININE LEVEL PROBLEM
Some statistics
Analyzer A: mean = 105.75; median = 99.5
Analyzer B: mean = 97.5; median = 89.5
Let difference = Analyzer A - Analyzer B
d=8.25
Md = 7
data: Analyzer A
W = 0.88028
p-value = 0.1895
Wilk-Shapiro Test for Normality
data: Analyzer B
W = 0.91541
p-value = 0.3937
Ha: not equal to 0
t = 2.9652
p-value = 0.02095
data: difference
W = 0.95788
p-value 0.7897
Student's t-test on Paired Samples: Analyzer A vs Analyzer B
Ha: less than 0
t = 2.9652
p-value = 0.9895
Ha: greater than 0
t = 2.9652
p-value = 0.01048
Wilcoxon Matched-Pairs Signed Ranks Test: Analyzer A vs Analyzer B
Ha: not equal to 0
Ha: less than 0
Ha: greater than 0
V = 27
V = 27
V = 27
p-value = 0.03461
p-value = 0.9888
p-value
0.01731
F-test for Equality of Variances
F = 1.1311
p-value = 0.856
Student's t-test on Two Independent Pop'n Means: Analyzer A vs Analyzer B
Ha: not equal to 0
Ha: less than 0.
Ha: greater than 0
t = 9.2109
t = 9.2109
t = 9.2109
p-value 0.00003668 p-value=1
p-value = 0.00001834
Welch's t-test on Two Independent Pop'n Means: Analyzer A vs Analyzer B
Ha: not equal to 0
Ha: less than 0
Ha: greater than 0
t = 9.4637
t = 9.4637
t = 9.4637
p-value = 1
p-value = 0.00003073
p-value = 0.00001537
Mann-Whitney Test on Two Independent Pop'n Means: Analyzer A vs Analyzer B
Ha: not equal to 0.
Ha: greater than 0
Ha: less than 0
W = 36
W = 36
W = 36
p-value = 0.01427
p-value = 0.9952
p-value
0.007133
Expert Solution
This question has been solved!
Explore an expertly crafted, step-by-step solution for a thorough understanding of key concepts.

Step by step
Solved in 3 steps

Recommended textbooks for you
MATLAB: An Introduction with Applications
Statistics
ISBN:
9781119256830
Author:
Amos Gilat
Publisher:
John Wiley & Sons Inc

Probability and Statistics for Engineering and th…
Statistics
ISBN:
9781305251809
Author:
Jay L. Devore
Publisher:
Cengage Learning

Statistics for The Behavioral Sciences (MindTap C…
Statistics
ISBN:
9781305504912
Author:
Frederick J Gravetter, Larry B. Wallnau
Publisher:
Cengage Learning
MATLAB: An Introduction with Applications
Statistics
ISBN:
9781119256830
Author:
Amos Gilat
Publisher:
John Wiley & Sons Inc
Probability and Statistics for Engineering and th…
Statistics
ISBN:
9781305251809
Author:
Jay L. Devore
Publisher:
Cengage Learning
Statistics for The Behavioral Sciences (MindTap C…
Statistics
ISBN:
9781305504912
Author:
Frederick J Gravetter, Larry B. Wallnau
Publisher:
Cengage Learning

Elementary Statistics: Picturing the World (7th E…
Statistics
ISBN:
9780134683416
Author:
Ron Larson, Betsy Farber
Publisher:
PEARSON

The Basic Practice of Statistics
Statistics
ISBN:
9781319042578
Author:
David S. Moore, William I. Notz, Michael A. Fligner
Publisher:
W. H. Freeman

Introduction to the Practice of Statistics
Statistics
ISBN:
9781319013387
Author:
David S. Moore, George P. McCabe, Bruce A. Craig
Publisher:
W. H. Freeman