D. Assume this economy experienced recession due to a pandemic that caused massive unemployment. Illustrate this effect on the graph of PPF on (A) and label this as PPF2. E. Assume that a new production technology was invented in the production of rice. Illustrate this effect on the graph of PPF on (A) and label this as PPF3.
D. Assume this economy experienced recession due to a pandemic that caused massive unemployment. Illustrate this effect on the graph of PPF on (A) and label this as PPF2. E. Assume that a new production technology was invented in the production of rice. Illustrate this effect on the graph of PPF on (A) and label this as PPF3.

Chapter3: Scarcity, Trade-offs, And Production Possibilities
Section: Chapter Questions
Problem 7P

Related questions
Question
Hello1 can anyone please help me answer the questions D and E with a complete solution and step-by-step explanation? Thank you so much!
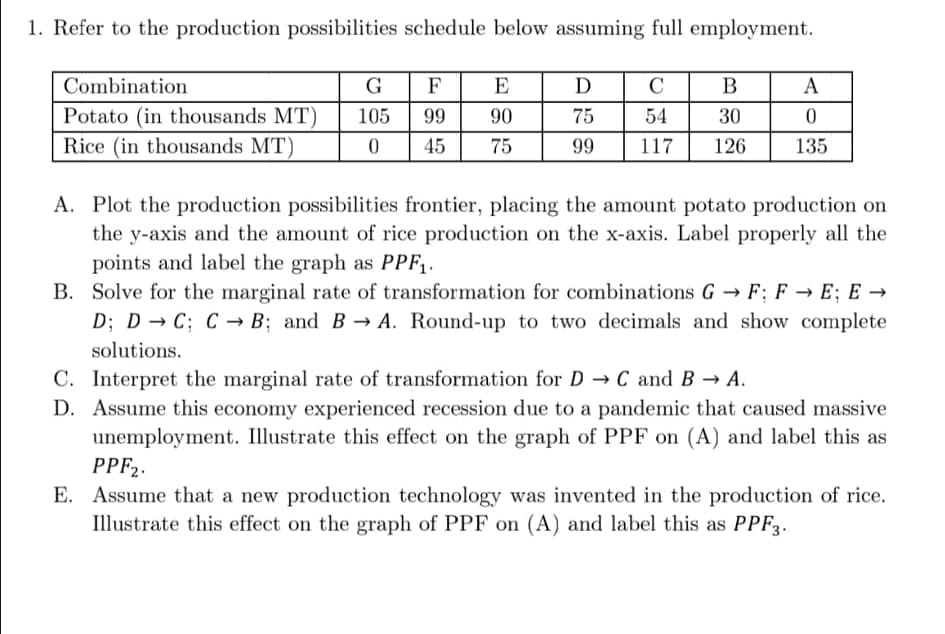
Transcribed Image Text:1. Refer to the production possibilities schedule below assuming full employment.
Combination
G F
E
D
C
B
A
Potato (in thousands MT)
105
99
90
75
54
30
Rice (in thousands MT)
45
75
99
117
126
135
A. Plot the production possibilities frontier, placing the amount potato production on
the y-axis and the amount of rice production on the x-axis. Label properly all the
points and label the graph as PPF1.
B. Solve for the marginal rate of transformation for combinations G → F; F → E; E →
D; D → C; C → B; and B→ A. Round-up to two decimals and show complete
solutions.
C. Interpret the marginal rate of transformation for D C and B → A.
D. Assume this economy experienced recession due to a pandemic that caused massive
unemployment. Illustrate this effect on the graph of PPF on (A) and label this as
PPF2.
E. Assume that a new production technology was invented in the production of rice.
Illustrate this effect on the graph of PPF on (A) and label this as PPF3.
Expert Solution
This question has been solved!
Explore an expertly crafted, step-by-step solution for a thorough understanding of key concepts.

Step by step
Solved in 2 steps with 2 images

Recommended textbooks for you
Exploring Economics
Economics
ISBN:
9781544336329
Author:
Robert L. Sexton
Publisher:
SAGE Publications, Inc

Principles of Economics 2e
Economics
ISBN:
9781947172364
Author:
Steven A. Greenlaw; David Shapiro
Publisher:
OpenStax
Exploring Economics
Economics
ISBN:
9781544336329
Author:
Robert L. Sexton
Publisher:
SAGE Publications, Inc
Principles of Economics 2e
Economics
ISBN:
9781947172364
Author:
Steven A. Greenlaw; David Shapiro
Publisher:
OpenStax