The blue (inner) curve on the following graph shows the current production possibilities curve (PPC) for the economy of Econoland, and the green (outer) curve shows the PPC for Econoland next year if the economy were to operate at point B today. That is, investment choices today impact the growth of the economy, and thus the PPC for next year. PPC Next Year PPC Today CAPITAL GOODS CONSUMPTION GOODS
The blue (inner) curve on the following graph shows the current production possibilities curve (PPC) for the economy of Econoland, and the green (outer) curve shows the PPC for Econoland next year if the economy were to operate at point B today. That is, investment choices today impact the growth of the economy, and thus the PPC for next year. PPC Next Year PPC Today CAPITAL GOODS CONSUMPTION GOODS

Chapter2: Productions Possibilities, Opportunity Costs, And Economic Growth
Section: Chapter Questions
Problem 9SQ

Related questions
Question
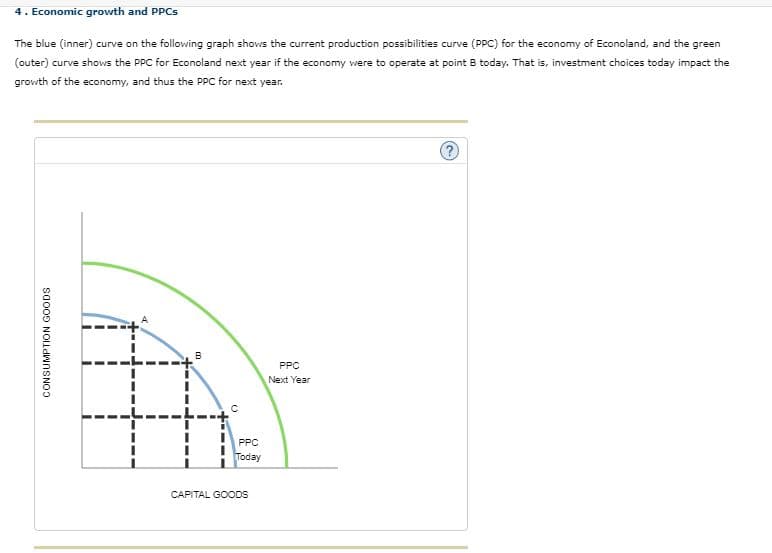
Transcribed Image Text:4. Economic growth and PPCS
The blue (inner) curve on the following graph shows the current production possibilities curve (PPC) for the economy of Econoland, and the green
(outer) curve shows the PPC for Econoland next year if the economy were to operate at point B today. That is, investment choices today impact the
growth of the economy, and thus the PPC for next year.
PPC
Next Year
PPC
Today
CAPITAL GOODS
CONSUMPTION GOODS
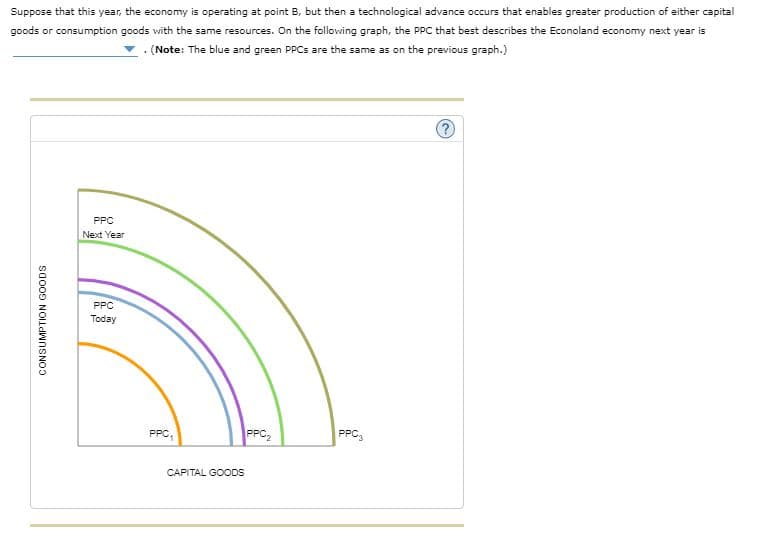
Transcribed Image Text:Suppose that this year, the economy is operating at point B, but then a technological advance occurs that enables greater production of either capital
goods or consumption goods with the same resources. On the following graph, the PPC that best describes the Econoland economy next year is
. (Note: The blue and green PPCS are the same as on the previous graph.)
PPC
Next Year
PPC
Today
PPC2
PPC,
PPC,
CAPITAL GOODS
CONSUMPTION GOODS
Expert Solution
This question has been solved!
Explore an expertly crafted, step-by-step solution for a thorough understanding of key concepts.

This is a popular solution!

Trending now
This is a popular solution!

Step by step
Solved in 2 steps with 2 images

Recommended textbooks for you


Essentials of Economics (MindTap Course List)
Economics
ISBN:
9781337091992
Author:
N. Gregory Mankiw
Publisher:
Cengage Learning

Brief Principles of Macroeconomics (MindTap Cours…
Economics
ISBN:
9781337091985
Author:
N. Gregory Mankiw
Publisher:
Cengage Learning