d. What plant size would the firm need in order to achieve minimum efficient scale (MES)? e. At what output level does the firm achieve MES? Output: f. If R2D2 is producing an output of 10 in plant 3, does excess capacity exist? g. What would be the economic capacity for plant 2? Output: h. Given the LRAC curve in the above graph, at what output levels are there economies of scale? Outputs up to i. Given the LRAC curve in the above graph, between what output levels are constant returns to scale present? Outputs between and j. Given the LRAC curve in the above graph, above what output levels do diseconomies of scale exist? Output above
d. What plant size would the firm need in order to achieve minimum efficient scale (MES)? e. At what output level does the firm achieve MES? Output: f. If R2D2 is producing an output of 10 in plant 3, does excess capacity exist? g. What would be the economic capacity for plant 2? Output: h. Given the LRAC curve in the above graph, at what output levels are there economies of scale? Outputs up to i. Given the LRAC curve in the above graph, between what output levels are constant returns to scale present? Outputs between and j. Given the LRAC curve in the above graph, above what output levels do diseconomies of scale exist? Output above

Microeconomics: Principles & Policy
14th Edition
ISBN:9781337794992
Author:William J. Baumol, Alan S. Blinder, John L. Solow
Publisher:William J. Baumol, Alan S. Blinder, John L. Solow
Chapter7: Production, Inputs, And Cost: Building Blocks For Supply Analysis
Section: Chapter Questions
Problem 7TY

Related questions
Question
100%
d. What plant size would the firm need in order to achieve minimum efficient scale (MES)?
e. At what output level does the firm achieve MES?
Output:
f. If R2D2 is producing an output of 10 in plant 3, does excess capacity exist?
g. What would be the economic capacity for plant 2?
Output:
h. Given the LRAC curve in the above graph, at what output levels are there economies of scale?
Outputs up to
i. Given the LRAC curve in the above graph, between what output levels are constant returns to scale present?
Outputs between and
j. Given the LRAC curve in the above graph, above what output levels do diseconomies of scale exist?
Output above
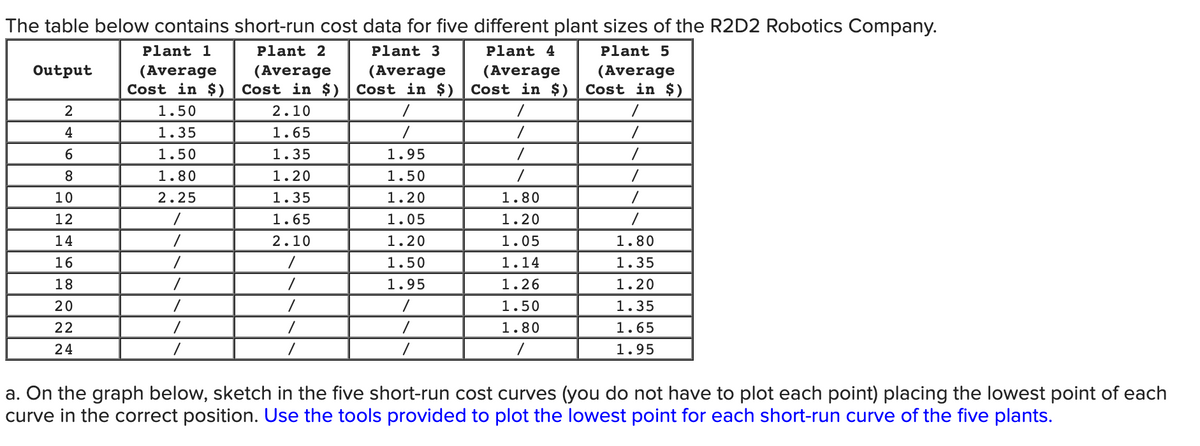
Transcribed Image Text:The table below contains short-run cost data for five different plant sizes of the R2D2 Robotics Company.
Plant 2
Plant 3
Plant 4
Plant 5
(Average (Average
Cost in $) Cost in $)
2.10
/
/
1.95
1.50
1.20
1.05
1.20
1.50
1.95
/
/
/
Output
2
4
6
8
10
12
14
16
18
20
22
24
Plant 1
(Average
Cost in $)
1.50
1.35
1.50
1.80
2.25
/
/
/
/
/
/
1.65
1.35
1.20
1.35
1.65
2.10
/
/
/
/
/
(Average
Cost in $)
/
/
/
/
1.80
1.20
1.05
1.14
1.26
1.50
1.80
(Average
Cost in $)
/
/
/
/
/
/
1.80
1.35
1.20
1.35
1.65
1.95
a. On the graph below, sketch in the five short-run cost curves (you do not have to plot each point) placing the lowest point of each
curve in the correct position. Use the tools provided to plot the lowest point for each short-run curve of the five plants.
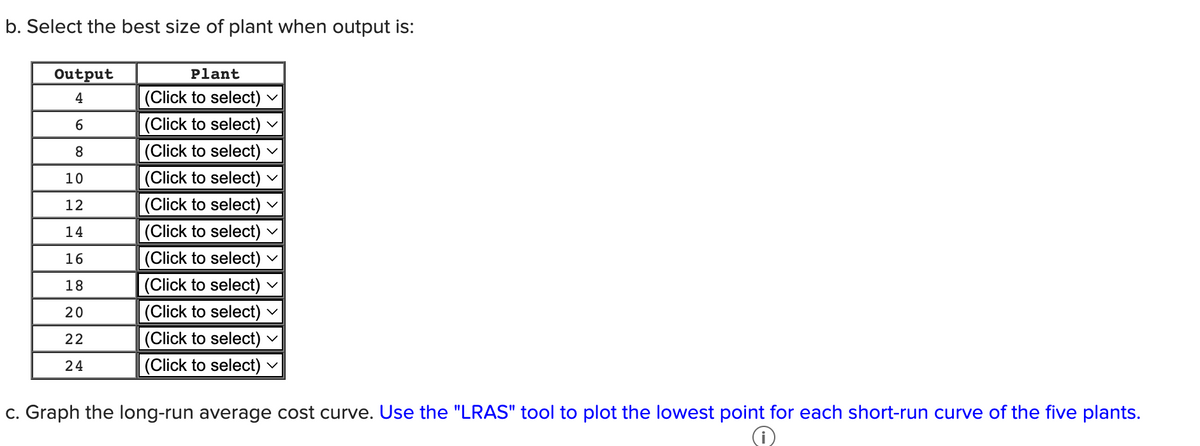
Transcribed Image Text:b. Select the best size of plant when output is:
Output
4
6
8
10
12
14
16
18
20
22
24
Plant
(Click to select)
(Click to select) ✓
(Click to select)
(Click to select) ✓
(Click to select) ✓
(Click to select)
(Click to select) ✓
(Click to select) V
(Click to select)
(Click to select) ✓
(Click to select) ✓
c. Graph the long-run average cost curve. Use the "LRAS" tool to plot the lowest point for each short-run curve of the five plants.
i
Expert Solution
This question has been solved!
Explore an expertly crafted, step-by-step solution for a thorough understanding of key concepts.

Step by step
Solved in 3 steps with 2 images

Knowledge Booster


Learn more about
Need a deep-dive on the concept behind this application? Look no further. Learn more about this topic, economics and related others by exploring similar questions and additional content below.Recommended textbooks for you
Microeconomics: Principles & Policy
Economics
ISBN:
9781337794992
Author:
William J. Baumol, Alan S. Blinder, John L. Solow
Publisher:
Cengage Learning


Microeconomics: Principles & Policy
Economics
ISBN:
9781337794992
Author:
William J. Baumol, Alan S. Blinder, John L. Solow
Publisher:
Cengage Learning


Managerial Economics: A Problem Solving Approach
Economics
ISBN:
9781337106665
Author:
Luke M. Froeb, Brian T. McCann, Michael R. Ward, Mike Shor
Publisher:
Cengage Learning