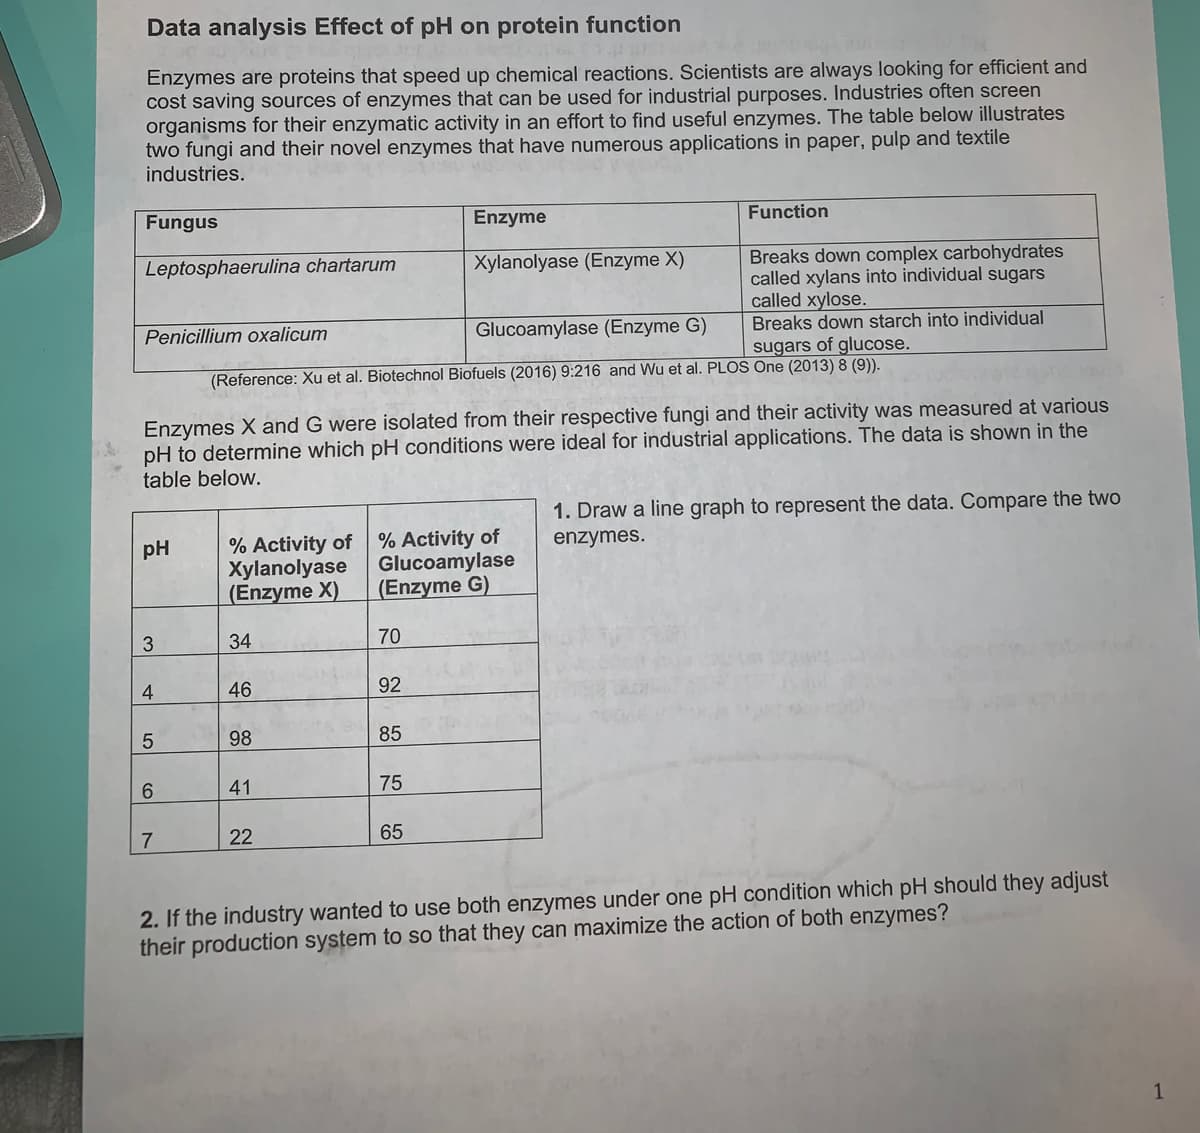
Data analysis Effect of pH on protein function Enzymes are proteins that speed up chemical reactions. Scientists are always looking for efficient and cost saving sources of enzymes that can be used for industrial purposes. Industries often screen organisms for their enzymatic activity in an effort to find useful enzymes. The table below illustrates two fungi and their novel enzymes that have numerous applications in paper, pulp and textile industries. Fungus Enzyme Function Breaks down complex carbohydrates called xylans into individual sugars called xylose. Breaks down starch into individual sugars of glucose. Leptosphaerulina chartarum Xylanolyase (Enzyme X) Penicillium oxalicum Glucoamylase (Enzyme G) (Reference: Xu et al. Biotechnol Biofuels (2016) 9:216 and Wu et al. PLOS One (2013) 8 (9)). Enzymes X and G were isolated from their respective fungi and their activity was measured at various pH to determine which pH conditions were ideal for industrial applications. The data is shown in the table below. 1. Draw a line graph to represent the data. Compare the two % Activity of Xylanolyase (Enzyme X) % Activity of Glucoamylase (Enzyme G) pH enzymes. 34 70 46 92 98 85 6. 75 7 22 65 41 3. 4-
Data analysis Effect of pH on protein function Enzymes are proteins that speed up chemical reactions. Scientists are always looking for efficient and cost saving sources of enzymes that can be used for industrial purposes. Industries often screen organisms for their enzymatic activity in an effort to find useful enzymes. The table below illustrates two fungi and their novel enzymes that have numerous applications in paper, pulp and textile industries. Fungus Enzyme Function Breaks down complex carbohydrates called xylans into individual sugars called xylose. Breaks down starch into individual sugars of glucose. Leptosphaerulina chartarum Xylanolyase (Enzyme X) Penicillium oxalicum Glucoamylase (Enzyme G) (Reference: Xu et al. Biotechnol Biofuels (2016) 9:216 and Wu et al. PLOS One (2013) 8 (9)). Enzymes X and G were isolated from their respective fungi and their activity was measured at various pH to determine which pH conditions were ideal for industrial applications. The data is shown in the table below. 1. Draw a line graph to represent the data. Compare the two % Activity of Xylanolyase (Enzyme X) % Activity of Glucoamylase (Enzyme G) pH enzymes. 34 70 46 92 98 85 6. 75 7 22 65 41 3. 4-

Chapter2: Where, Why, And What
Section: Chapter Questions
Problem 17MC

Related questions

Question
I would like the question answered 1,2,3 (all parts thats included, and 4

Transcribed Image Text:Data analysis Effect of pH on protein function
Enzymes are proteins that speed up chemical reactions. Scientists are always looking for efficient and
cost saving sources of enzymes that can be used for industrial purposes. Industries often screen
organisms for their enzymatic activity in an effort to find useful enzymes. The table below illustrates
two fungi and their novel enzymes that have numerous applications in paper, pulp and textile
industries.
Fungus
Enzyme
Function
Breaks down complex carbohydrates
called xylans into individual sugars
called xylose.
Breaks down starch into individual
sugars of glucose.
Leptosphaerulina chartarum
Xylanolyase (Enzyme X)
Penicillium oxalicum
Glucoamylase (Enzyme G)
(Reference: Xu et al. Biotechnol Biofuels (2016) 9:216 and Wu et al. PLOS One (2013) 8 (9)).
Enzymes X and G were isolated from their respective fungi and their activity was measured at various
pH to determine which pH conditions were ideal for industrial applications. The data is shown in the
table below.
1. Draw a line graph to represent the data. Compare the two
% Activity of
Xylanolyase
(Enzyme X)
% Activity of
Glucoamylase
(Enzyme G)
pH
enzymes.
34
70
46
92
98
85
6.
75
7
22
65
41
3.
4-
Expert Solution
This question has been solved!
Explore an expertly crafted, step-by-step solution for a thorough understanding of key concepts.

This is a popular solution!

Trending now
This is a popular solution!

Step by step
Solved in 3 steps with 1 images

Knowledge Booster


Learn more about
Need a deep-dive on the concept behind this application? Look no further. Learn more about this topic, biology and related others by exploring similar questions and additional content below.Recommended textbooks for you
Essentials Health Info Management Principles/Prac…
Health & Nutrition
ISBN:
9780357191651
Author:
Bowie
Publisher:
Cengage
Essentials Health Info Management Principles/Prac…
Health & Nutrition
ISBN:
9780357191651
Author:
Bowie
Publisher:
Cengage

Medical Terminology for Health Professions, Spira…
Health & Nutrition
ISBN:
9781305634350
Author:
Ann Ehrlich, Carol L. Schroeder, Laura Ehrlich, Katrina A. Schroeder
Publisher:
Cengage Learning
Health Safety And Nutrition F/Young Child
Health & Nutrition
ISBN:
9781305144767
Author:
MAROTZ
Publisher:
Cengage