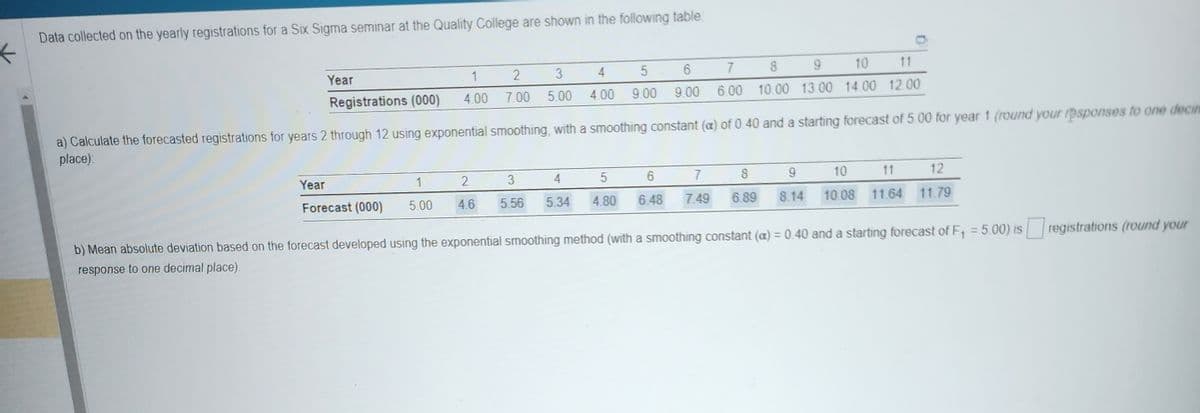
Data collected on the yearly registrations for a Six Sigma seminar at the Quality College Year 1 4.00 Year Forecast (000) 2 3 7.00 5.00 1 2 5.00 4.6 4 5 4.00 9.00 Registrations (000) a) Calculate the forecasted registrations for years 2 through 12 using exponential smoothing, with a smoothing constant (a) of 0.40 and a starting forecast of 5.00 for year 1 (round your responses to one dece place) 3 4 5.56 5.34 6 9.00 5 4.80 11 9 8 10 7 6.00 10.00 13.00 14.00 12.00 7 8 6 6.48 7.49 6.89 9 8.14 11 10 12 10.08 11.64 11.79 b) Mean absolute deviation based on the forecast developed using the exponential smoothing method (with a smoothing constant (a)= 0.40 and a starting forecast of F, = 5.00) is response to one decimal place). registrations (round your
Q: efer to the information above. What is the optimal number of orders per year? a. 200
A: The economic order quantity is the number of units of a product that a buyer needs to order at one…
Q: For questions 32-35, use the word list to label the circular flow diagram.
A: 32 . FACTOR MARKET 33 . Households sell the factors of production
Q: The inventory record (tem master file) shows the following planning factors batches are set at…
A: Batches set at = 20 Quantities Available inventory = 80 Lead time = 2 weeks To be determined -…
Q: 3. Southeastern Bell stocks a certain switch connector at its central warehouse for supplying…
A: Given data is Annual demand (D) = 15000 units Holding cost (H) = $24 Ordering cost (S) = $75 Working…
Q: Company X is the leading producer of state-of-the-art printers. They have been developing a layout…
A: Organizations are daily getting indulged in their complex operations that bring about a big change…
Q: Who has the lowest productivity? Workers Orders Processed Customer Type Hours Worked Wage/hr:…
A: Productivity per labor $ = output/(labor hours* labor wage per hr)
Q: A cafeteria serving line has a coffee urn from which customers serve themselves. Arrivals at the urn…
A: Given data is Arrival rate (lambda) = 2 per minute Service rate (mu) = 25 seconds = 6025=2.4 mins
Q: (a) Graph the constraints for this problem. Use dots to indicate all feasible integer solutions. X₂…
A: Linear programming is a mathematical technique that is also used in operations management…
Q: Consider the simplex tableau given below. X₁ x₂ X3 $₁ S₂ S3 3 0 1 3 0 0 0 0 0 -2 2 1 2 0 x₂ = O X₁,…
A: The simplex method is an algebraic technique to solve linear programming questions. Using the…
Q: enterprise wide risk management system (EWRMS) with particular emphasis on how this differs from a…
A: Basic risk management Organizations with…
Q: Cost Flow Methods The following three identical units of Item K113 are purchased during April:…
A: Given data is Date Units Cost ($) April 2 1 purchased 205 April 15 1 purchased 207 April…
Q: Outline the organisational documentation applicable to project integration and associated processes.
A: Integration management in projects is a sub field of project management that facilitates effective…
Q: The selling price per box for Cynthia's Cookies is $20.24. Fixed costs are $60,000 and the variable…
A: Selling Price per box = SP = $20.24 Fixed Costs = FC = $60000 Variable Cost per box = VC = $10.43
Q: Amazon delivering books from their warehouses would be an example of what kind of transformation…
A: Amazon delivering books from their warehouses would be an example of what kind of transformation…
Q: 6. A business hands out promotional fliers to 15,000 people. It is estimated that of those they…
A: Number of people to whom promotional fliers are handed = 15000 people Percentage of individuals who…
Q: Thermostats are subjected to rigorous testing before they are shipped to air conditioning…
A: Control chart is a statistical tool which helps t identify the process controllability based on…
Q: A grocery store manager must decide how to best present a limited supply of popcorn and soda to its…
A: Given data is Profit ($) Available Minimum stock Popcorn 1.35 115 tuns 80 tins Soda 2.45…
Q: Company XYZ has a specialised machine shop. As the maintenance team, you requested to implement new…
A: A quantity discount model is nothing but an inventory model working on a concept of discount. This…
Q: The aim of the objective function should be to Minimize the objective value The optimum solution is…
A: Linear programming is a mathematical technique that is also used in operations management…
Q: A project is scheduled to complete in six months duration. There are two activities in the project.…
A: Actual cost of Activity 1 = AC1 = SAR 300,000 Actual cost of Activity 2 = AC2 = SAR 200,000 Planned…
Q: 11. The distribution system for the Herman Company consists of three plants, two ware- houses, and…
A:
Q: What is the probability that the system is empty? What is the probability that a customer must…
A: Given: Arrival rate (A) 1.70 Service rate (S) =60/26=2.308 number of servers C 1.00
Q: Indicate three companies in which internal and external quality controls are carried out; the…
A: https://portal.bartleby.com/questions/7b37d639-1260-4d59-8a99-22eb85ac4d06/answer Indicate three…
Q: What upgrades could be made to your products or services to make it better? Explain your answer.
A: The process of making significant product changes that either attract new customers or enhance the…
Q: Calculate average waiting time for ATM user at the BBT location 2. Calculate average length of…
A: NOTE: We are allowed to do the first three sub-parts only. Given: Arrival rate (A) = 21 Service…
Q: Consider the network described in the table below. Activity Immediate Predecessor(s)…
A: A network diagram is a visual representation of a project which helps to identify the critical path…
Q: A stock item has a count of 792 units, a cost of R3 and carrying charge of 20%. If the item is used…
A: Given: On- hand inventory = 792 usage per day = 36
Q: The production process shown below consists of five stages. The numbers in parentheses are the times…
A: Find the Given details below: Given details: Stage Time taken for an unit A 4 minutes B 3…
Q: Explain the key aspects of operation management decision making
A: According to the business definition, operations management is the design, execution, and control of…
Q: The Carbondale Hospital is considering the purchase of a new ambulance. The decision will rest…
A: 2 year moving average is calculate by the sum of last two year and divided with number of moving…
Q: Project management tools and techniques........................ Are used to select the…
A: Are used to select the appropriate and potential projects:- Project management tools and techniques…
Q: List out the benefits of biometric authentication?
A: Ans) Biometric authentication as the name suggests it is the process of authenticating each and…
Q: A plant is acquiring new production machinery. Before the machinery can be fully functional, a…
A: Network diagram is a graphical representation of a project which helps to identify the activity…
Q: facilities and faculty to accommodate an enrollment of 1,500 new students per academic year. Yet, to…
A: Production is the process in which inputs are combined to have the required output. It includes a…
Q: An appliance manufacturer wants to contract with a repair shop to handle authorized repairs In…
A: Process capability Ratio (Cpk) is a statistical tool which helps to identify the process capability…
Q: Sunset Airlines is concerned about the level of service for its check-in procedure. Currently, a…
A: *As per guidelines first three parts are answerable. Given data: Customer arrival rate (λ) =15…
Q: 9. Mean time between failure O A. is used to measure a product's maintainability B. is used to…
A: Mean time between failures is a concept applied in operations management where long-term capital…
Q: A Pareto diagram A. shows the prevalence of the various types of defects that have been found. B.…
A: A pareto diagram is a bar diagram which helps to identify the frequency and distribution…
Q: Solve the problem for each of the following objective functions: (Two-Pha Method) (a) Maximize z 2x1…
A: As per Bartleby guidelines, we can only solve the first three subparts of one question at a…
Q: Lead time for one of your fastest-moving products is 20 days. Demand during this period averages…
A: Given data is Lead time (L) = 20 days Average demand (D) = 110 units per day
Q: Given the following AOA network diagram and activity duration information, determine the Earliest…
A: The CRITICAL PATH consists of three parts: - The first part is the "strategic fit" which has to do…
Q: Arnold Tofu owns and operates a chain of 12 vegetable protein “hamburger” restaurants in northern…
A: An estimate of the line that depicts the actual but unidentified linear connection between the two…
Q: Hart Manufacturing makes three products. Each product requires manufacturing operations in three…
A: As per the given instructions, the decision variables are as follows. P1 = Units of product 1…
Q: Based on the critical ratio determined, the company would expect the stockout rate to be % (use the…
A: Here, Given the data, The selling price is 2 per loaf The cost is 0.50 per loaf As there is an 80%…
Q: IN THE MID-1960S, WALT DISNEY’S DREAM was to build a family resort destination like no other. The…
A: Forecasting is a technique to predict future value. It is useful to predict future demand, sales, or…
Q: want to optimize some legacy processes within your organization. How might you go about it?
A: Many service departments use legacy systems, which are those that were created using antiquated…
Q: (a) Formulate a linear programming model for maximizing total profit contribution. (Let P, units of…
A: Linear programming is a mathematical technique that is also used in operations management…
Q: A medical facility does MRIs for sports Injuries. Occasionally, a test yields inconclusive results…
A: P-chart is a model of control chart which considering the proportionate value for calculating the…
Q: Coffee Shop campus has one barista. Students arrive at the rate of 20 students per hour according a…
A:
Q: 1. A company would like to develop an aggregate plan and evaluate its cost using the transportation…
A:
Step by step
Solved in 3 steps
- The file P13_29.xlsx contains monthly time series data for total U.S. retail sales of building materials (which includes retail sales of building materials, hardware and garden supply stores, and mobile home dealers). a. Is seasonality present in these data? If so, characterize the seasonality pattern. b. Use Winters method to forecast this series with smoothing constants = = 0.1 and = 0.3. Does the forecast series seem to track the seasonal pattern well? What are your forecasts for the next 12 months?The file P13_42.xlsx contains monthly data on consumer revolving credit (in millions of dollars) through credit unions. a. Use these data to forecast consumer revolving credit through credit unions for the next 12 months. Do it in two ways. First, fit an exponential trend to the series. Second, use Holts method with optimized smoothing constants. b. Which of these two methods appears to provide the best forecasts? Answer by comparing their MAPE values.The Baker Company wants to develop a budget to predict how overhead costs vary with activity levels. Management is trying to decide whether direct labor hours (DLH) or units produced is the better measure of activity for the firm. Monthly data for the preceding 24 months appear in the file P13_40.xlsx. Use regression analysis to determine which measure, DLH or Units (or both), should be used for the budget. How would the regression equation be used to obtain the budget for the firms overhead costs?
- The file P13_22.xlsx contains total monthly U.S. retail sales data. While holding out the final six months of observations for validation purposes, use the method of moving averages with a carefully chosen span to forecast U.S. retail sales in the next year. Comment on the performance of your model. What makes this time series more challenging to forecast?The file P13_26.xlsx contains the monthly number of airline tickets sold by the CareFree Travel Agency. a. Create a time series chart of the data. Based on what you see, which of the exponential smoothing models do you think will provide the best forecasting model? Why? b. Use simple exponential smoothing to forecast these data, using a smoothing constant of 0.1. c. Repeat part b, but search for the smoothing constant that makes RMSE as small as possible. Does it make much of an improvement over the model in part b?The file P13_02.xlsx contains five years of monthly data on sales (number of units sold) for a particular company. The company suspects that except for random noise, its sales are growing by a constant percentage each month and will continue to do so for at least the near future. a. Explain briefly whether the plot of the series visually supports the companys suspicion. b. By what percentage are sales increasing each month? c. What is the MAPE for the forecast model in part b? In words, what does it measure? Considering its magnitude, does the model seem to be doing a good job? d. In words, how does the model make forecasts for future months? Specifically, given the forecast value for the last month in the data set, what simple arithmetic could you use to obtain forecasts for the next few months?
- Suppose that a regional express delivery service company wants to estimate the cost of shipping a package (Y) as a function of cargo type, where cargo type includes the following possibilities: fragile, semifragile, and durable. Costs for 15 randomly chosen packages of approximately the same weight and same distance shipped, but of different cargo types, are provided in the file P13_16.xlsx. a. Estimate a regression equation using the given sample data, and interpret the estimated regression coefficients. b. According to the estimated regression equation, which cargo type is the most costly to ship? Which cargo type is the least costly to ship? c. How well does the estimated equation fit the given sample data? How might the fit be improved? d. Given the estimated regression equation, predict the cost of shipping a package with semifragile cargo.The file P13_25.xlsx contains the quarterly numbers of applications for home mortgage loans at a branch office of Northern Central Bank. a. Create a time series chart of the data. Based on what you see, which of the exponential smoothing models do you think will provide the best forecasting model? Why? b. Use simple exponential smoothing to forecast these data, using a smoothing constant of 0.1. c. Repeat part b, but search for the smoothing constant that makes RMSE as small as possible. Does it make much of an improvement over the model in part b? Is it guaranteed to produce better forecasts for the future?A small computer chip manufacturer wants to forecast monthly ozperating costs as a function of the number of units produced during a month. The company has collected the 16 months of data in the file P13_34.xlsx. a. Determine an equation that can be used to predict monthly production costs from units produced. Are there any outliers? b. How could the regression line obtained in part a be used to determine whether the company was efficient or inefficient during any particular month?
- The owner of a restaurant in Bloomington, Indiana, has recorded sales data for the past 19 years. He has also recorded data on potentially relevant variables. The data are listed in the file P13_17.xlsx. a. Estimate a simple regression equation involving annual sales (the dependent variable) and the size of the population residing within 10 miles of the restaurant (the explanatory variable). Interpret R-square for this regression. b. Add another explanatory variableannual advertising expendituresto the regression equation in part a. Estimate and interpret this expanded equation. How does the R-square value for this multiple regression equation compare to that of the simple regression equation estimated in part a? Explain any difference between the two R-square values. How can you use the adjusted R-squares for a comparison of the two equations? c. Add one more explanatory variable to the multiple regression equation estimated in part b. In particular, estimate and interpret the coefficients of a multiple regression equation that includes the previous years advertising expenditure. How does the inclusion of this third explanatory variable affect the R-square, compared to the corresponding values for the equation of part b? Explain any changes in this value. What does the adjusted R-square for the new equation tell you?The management of a technology company is trying to determine the variable that best explains the variation of employee salaries using a sample of 52 full-time employees; see the file P13_08.xlsx. Estimate simple linear regression equations to identify which of the following has the strongest linear relationship with annual salary: the employees gender, age, number of years of relevant work experience prior to employment at the company, number of years of employment at the company, or number of years of post secondary education. Provide support for your conclusion.Stock market analysts are continually looking for reliable predictors of stock prices. Consider the problem of modeling the price per share of electric utility stocks (Y). Two variables thought to influence this stock price are return on average equity (X1) and annual dividend rate (X2). The stock price, returns on equity, and dividend rates on a randomly selected day for 16 electric utility stocks are provided in the file P13_15.xlsx. Estimate a multiple regression equation using the given data. Interpret each of the estimated regression coefficients. Also, interpret the standard error of estimate and the R-square value for these data.