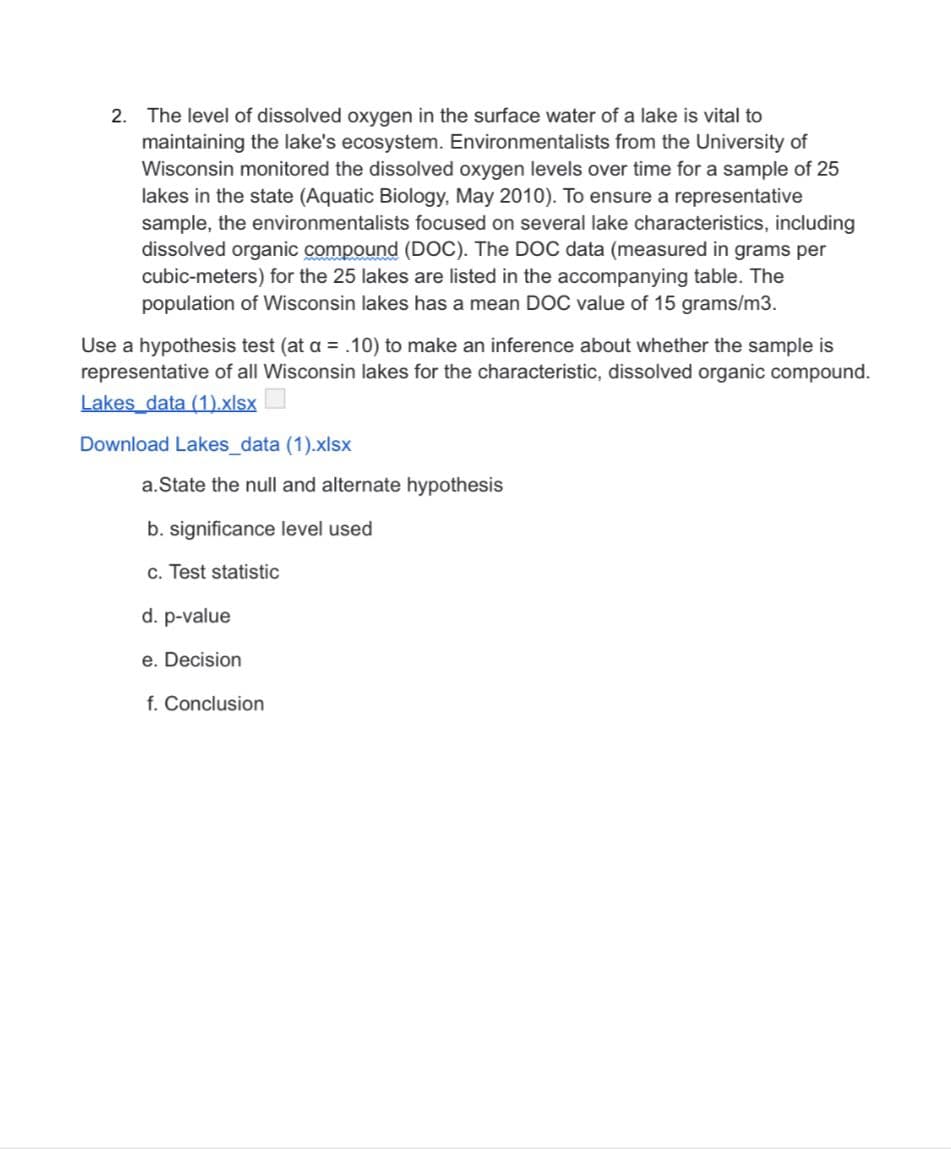
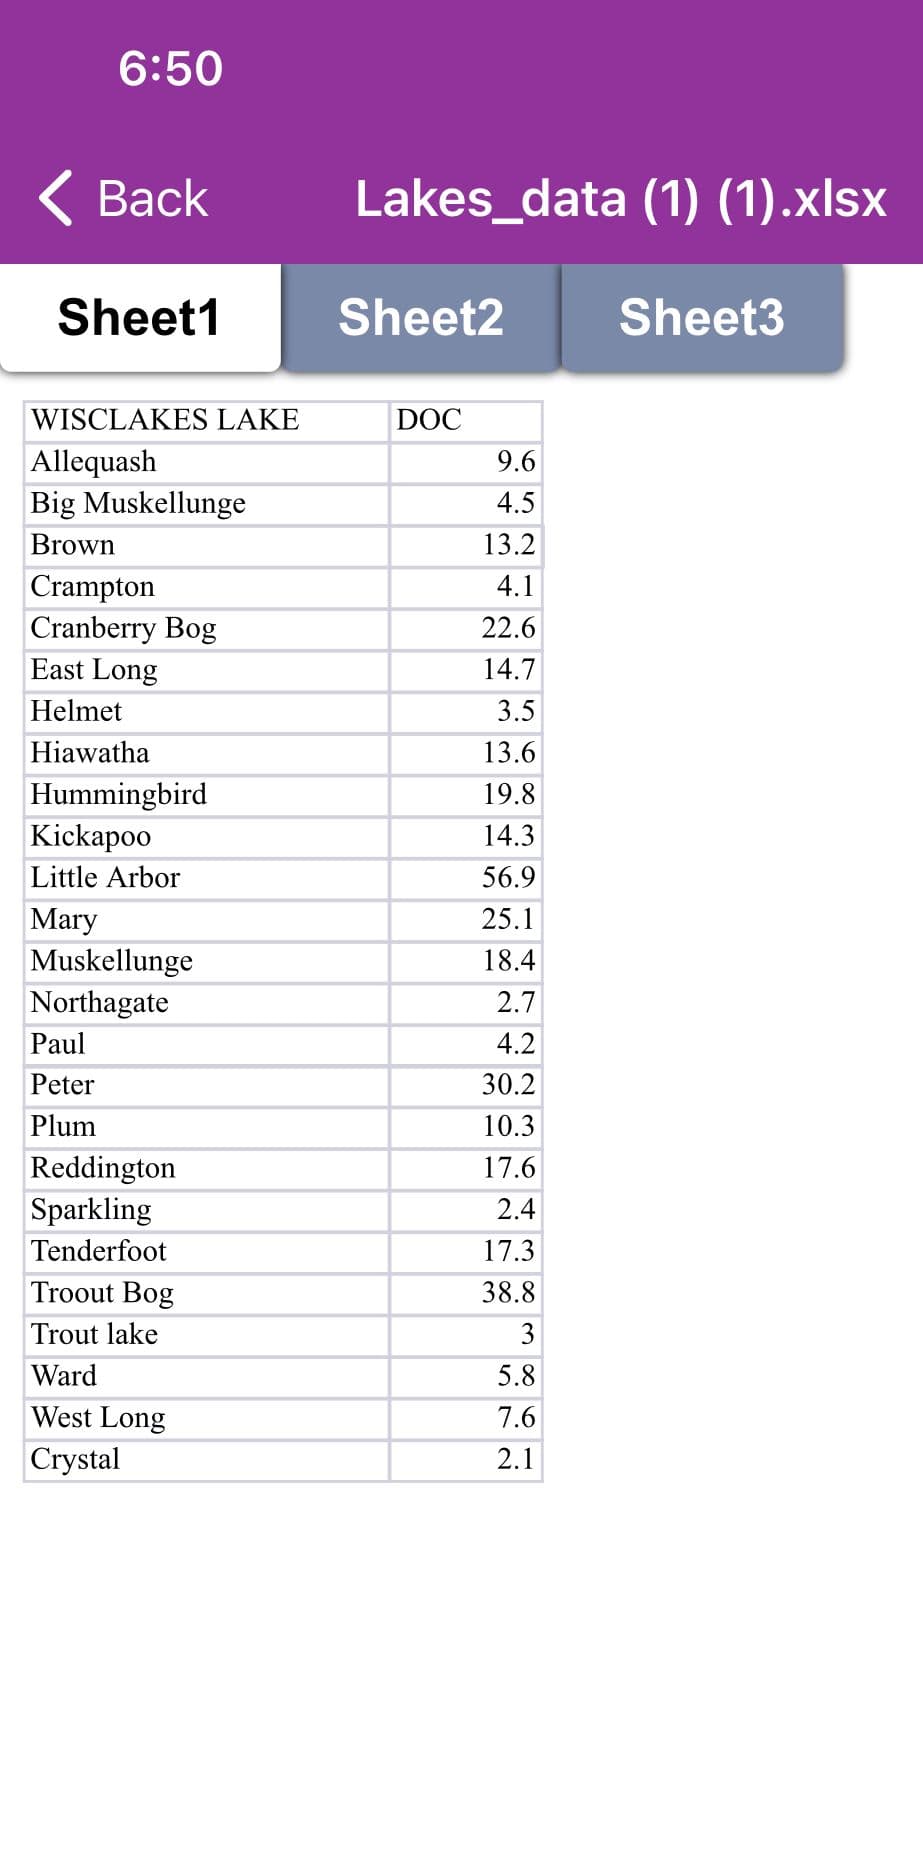
2. The level of dissolved oxygen in the surface water of a lake is vital to maintaining the lake's ecosystem. Environmentalists from the University of Wisconsin monitored the dissolved oxygen levels over time for a sample of 25 lakes in the state (Aquatic Biology, May 2010). To ensure a representative sample, the environmentalists focused on several lake characteristics, including dissolved organic compound (DOC). The DOC data (measured in grams per cubic-meters) for the 25 lakes are listed in the accompanying table. The population of Wisconsin lakes has a mean DOC value of 15 grams/m3. Use a hypothesis test (at a = .10) to make an inference about whether the sample is representative of all Wisconsin lakes for the characteristic, dissolved organic compound. Lakes data (1).xlsx Download Lakes_data (1).xlsx a.State the null and alternate hypothesis b. significance level used c. Test statistic d. p-value e. Decision f. Conclusion
Q: A chemical reaction is run 12 times, and the temperature xi (in °C) and the yield yi (in percent of…
A:
Q: 1. The efficiency ratio for a steel specimen immersed in a phosphating tank is the weight of the…
A: Given :The weight of the phosphate coating divided b the metal loss (both in mg/ft2 ).a) Now we may…
Q: Which pairs of months show significant differences in mean E. coli contamination? Explain your…
A: null hypothesis : there is no significant difference between whether the contamination of creeks…
Q: Ten alkalinity readings are made in the upper reaches of a river in the regions and fifteen in the…
A: Introduction: Denote μ1, μ2 as the true population mean alkalinity of water in the upper and lower…
Q: The article "Change in Creep Behavior of Plexiform Bone with Phosphate Ion Treatment" (R. Regimbal,…
A:
Q: Find the test statistic. (Round your answer to two decimal places.) F =
A: The ANOVA is conducted by using EXCEL. The software procedure is given below: Enter the data.…
Q: The Journal of Engineering in Industry (Aug. 1993) reported on an automated system designed to…
A: Part(a): The probability of machining combination defecting a flaw is, 1168 therefore, the…
Q: 1) In the previous exercise, you perform DMC to correct the data in Station X. Table below is the…
A:
Q: The time needed by a person to sort wet and dry wastes is to be determined so that it can be used as…
A: Given Information: Variable of interest=Time to segregate dry and wet wasteN=25Unit of…
Q: Mercury is a persistent and dispersive environmental contaminant found in many ecosystems around the…
A: a) Mean = 1.24 median = 0.57 There is heavy positive skewness in the data.
Q: A researcher wanted to determine if carpeted rooms contain more bacteria than uncarpeted rooms., The…
A: Given that If carpeted rooms more bacteria than uncarpeted room. I want to find null and…
Q: TABLE 10.22 Number of children with olonhea at 2 weeks of follow-up Number of chldren with otonhea…
A: Since you have asked multiple questions, we will solve the first question for you. If you want any…
Q: Part A: Does the mean E. coli contamination differ significantly among the four months? Justify your…
A: SS between months = SSmonths = 5992.500 The error sum of the square is given by ESS = 18568.5 -…
Q: Suppose a researcher believes that the occurrence of natural disasters such as earthquakes leads to…
A: a). Natural catastrophes have major effects for the well-being of those affected, especially in…
Q: Two analysts were given a standard reference material (SRM) and were asked to determine its copper…
A: Given the data of the results (mg/kg) of analysts A and B as Analyst A Analyst B 45.2 49.4…
Q: The vulnerability of inshore environments to contamination due to urban and industrial expansion in…
A: Hello there! there are more than 3 subparts in the question. According to our policies cna answer…
Q: 4. A material used in the construction industry contains an impurity suspected of having an adverse…
A: x p=(x-250)/50 y Δy Δ2y Δ3y Δ4y Δ5y Δ6y 100 -3 10.63 2.4…
Q: The time needed by a person to sort wet and dry wastes is to be determined so that it can be used as…
A: Introduction: The baseline amount of time (minutes) to measure the performance of the novel trash…
Q: In a process capability analysis, C, =, Cpi = - and Cu = 0. a) Show the location of the process…
A: Since you have asked a question with multiple subparts so as per guidelines we will solve first…
Q: d. How many member organizations need to be selected to have 95% confidence of estimating the…
A: d. A random sample of 100 member organizations is considered in which 40 members organizations have…
Q: Here is a dataset containing plant growth measurements of plants grown in solutions of…
A: Solution : Given : Dataset of Phragmites australis, a fast-growing non-native grass was grown in a…
Q: What is the average NO3- concentration at the upslope site (3 decimal places)? What is the average…
A: Hello there! there are many sub parts given in the question. According to our policies can answer…
Q: .A study was conducted to determine the level of cyanide in 20 exposed spot (soil and water) within…
A:
Q: In a study of exhaust emissions from school buses, the pollution intake by passengers was determined…
A:
Q: John investigated the quantitative determination of Cr in high-alloy steels by a potentiometric…
A: The results for the analysis of a single reference steel is given. Let xi denote the sample…
Q: The cetane number is a critical property in specifying the ignition quality of a fuel used in a…
A: Simple linear regression model: A simple linear regression model is given as y^ = b0 + bx + e…
Q: 2. To study the physical fitness for adult males in the 60-69 year age group, a sample of 28 people…
A: The given data set is: 60 62 62 65 65 65 68 70 72 75 75 76 79 80…
Q: Here is the dataset containing plant growth measurements, e of plants grown in solutions of…
A: Given information: Distilled H2O Petro NACl MgCl NaCl + MgCl 20 19.84 20 19.88 19.93 19.95…
Q: The article "Hydrogeochemical Characteristics of Groundwater in a Mid-Western Coastal Aquifer…
A: (a) Use EXCEL Procedure to obtain the values. Follow the instruction to obtain the values as…
Q: A major car manufacturer wants to test a new engine to determine whether it meets new air pollution…
A: From the given information, Sample size n =10 Using Excel function, “=AVERAGE (A1:A10)”, the Sample…
Q: 1st, compute the production indexes for aluminum, fertilizer, and lumber with time period 1 as the…
A: Index numbers are use to compare the value, price or quantity of a certain commodity in the current…
Q: A researcher wanted to determine if carpeted rooms contain more bacteria than uncarpeted rooms. The…
A: The P-value value is obtained by using EXCEL. The software procedure is given below: Enter the…
Q: A cohort study is conducted to assess the association between clinical characteristics and the risk…
A: To calculate cumulative incidence Cumulative incidence is calculated by the number of new cases…
Q: 4. An article in the Journal of Environmental Engineering (1989, Vol. 115(3), pp. 608-619) reported…
A: Steps to construct scatter plot in Excel: Enter the data for x and y in Excel sheet>Select the…
Q: The removal of ammoniacal nitrogen is an important aspect of treatment of leachate at landfill…
A: a. The null hypothesis assumes that the mean rates of removal for the five treatments do not vary,…
Q: Research was conducted on the amount of oxygen runners could utilize during training, known as their…
A: Given data is VO2 Max(ml/kg/min)(x) 5k Finishing Time(min)(y) 16.28 34.66 20.55 37.41…
Q: Explain the Stationarity in the AR(1) Model?
A: The General form of an AR (p) is given as
Q: '2. Establish control limits for the given data of number of defects in manufacturing process of…
A:
Q: 3. Suppose you are studying the distribution of zinc in a lake and want to know if there is a…
A: The solution given below with output of excel
Q: Department of Research and Development of Unilever Sdn Bhd has condi study to improve the quality of…
A: Given: n = 50
Q: 3. A manufacturer of paper used for making grocery bags is interested in improving the tensile…
A: There are 4 independent samples which are 4 types of hardwood concentrations. We have to test…
Q: a. At 0.05 level of significance test if the population variances differ for preservatives A and B.…
A: Given : Preservative Type Sample Size Degrees of Freedom Sample Mean Sample Standard Deviation…
Q: The cetane number is a critical property in specifying the ignition quality of a fuel used in a…
A: Given: n = 15 Formula Used: Confidence Interval for the slope of regression line:
Q: Listed below are the measured radiation absorption rates (in W/kg) corresponding to various cell…
A: The descriptive analysis is conducted using EXCEL. The software procedure is given below: Enter the…
Q: Write a narrative summary of these findings. Be sure to include a description of the total sample as…
A: The summary of the data is used to explain the characteristic and purpose of the observation.…
Q: The article "Oxidation State and Activities of Chromium Oxides in Cao-SiO,-CrO, Slag System" (Y.…
A: Hey there! Thank you for posting the question. Since your question has more than 3 parts, we are…
Q: 16) Unfortunately, arsenic occurs naturally in some ground water (Reference: Union Carbide Technical…
A: Note: You have solved part (a) correctly. As given, a random sample of 37 tests gave a sample…
Q: The article "Influence of Freezing Temperature on Hydraulic Conductivity of Silty Clay" (J. Konrad…
A: a. R-Code:
Q: A deficiency of the trace element selenium in the diet can negatively impact growth, immunity,…
A: Given table provides the selenium concentration for treatment group and control group at two time…
Trending now
This is a popular solution!
Step by step
Solved in 2 steps
- In a 1996 article published in Technometrics, 38, pp. 11–22, the authors discuss the reliability of nuclear power plant emergency generators. To control the risk of damage to the nuclear core during accidents at nuclear plants, the reliability of emergency diesel generators (EDG) to start on demand must be maintained at a very high level. At each nuclear power plant there are a number of such generators. An overall measure of reliability is obtained by counting the number of times the EDGs successfully work when needed. The table here provides the number of successful demands for implementation of an EDG between each subsequent failure in an EDG for all the EDGs at each of seven nuclear power plants. A regulatory agency wants to determine if there is a difference in the reliability of the seven nuclear power plants. (Use Data _8). Run an ANOVA (Regardless of the assumptions) and Kruskal–Wallis test.In a 1996 article published in Technometrics, 38, pp. 11–22, the authors discuss the reliability of nuclear power plant emergency generators. To control the risk of damage to the nuclear core during accidents at nuclear plants, the reliability of emergency diesel generators (EDG) to start on demand must be maintained at a very high level. At each nuclear power plant there are a number of such generators. An overall measure of reliability is obtained by counting the number of times the EDGs successfully work when needed. The table here provides the number of successful demands for implementation of an EDG between each subsequent failure in an EDG for all the EDGs at each of seven nuclear power plants. A regulatory agency wants to determine if there is a difference in the reliability of the seven nuclear power plants. (Use Data _8). Do the conditions necessary for conducting the ANOVA test appear to be satisfied by these data? Run an ANOVA (Regardless of the assumptions) and…In a 1996 article published in Technometrics, 38, pp. 11–22, the authors discuss the reliability of nuclear power plant emergency generators. To control the risk of damage to the nuclear core during accidents at nuclear plants, the reliability of emergency diesel generators (EDG) to start on demand must be maintained at a very high level. At each nuclear power plant there are a number of such generators. An overall measure of reliability is obtained by counting the number of times the EDGs successfully work when needed. The table here provides the number of successful demands for implementation of an EDG between each subsequent failure in an EDG for all the EDGs at each of seven nuclear power plants. A regulatory agency wants to determine if there is a difference in the reliability of the seven nuclear power plants. (Use Data _8). Do the conditions necessary for conducting the ANOVA test appear to be satisfied by these data?
- A mutual fund is a professionally managed investmentscheme that pools money from many investorsand invests in a variety of securities. Growth fundsfocus primarily on increasing the value of investments,whereas blended funds seek a balance betweencurrent income and growth. Here is data on theexpense ratio (expenses as a % of assets, from www.morningstar.com) for samples of 20 large-cap balancedfunds and 20 large-cap growth funds (“largecap”refers to the sizes of companies in which thefunds invest; the population sizes are 825 and 762,respectively):Bl 1.03 1.23 1.10 1.64 1.301.27 1.25 0.78 1.05 0.640.94 2.86 1.05 0.75 0.090.79 1.61 1.26 0.93 0.84Gr 0.52 1.06 1.26 2.17 1.550.99 1.10 1.07 1.81 2.050.91 0.79 1.39 0.62 1.521.02 1.10 1.78 1.01 1.15 a. Calculate and compare the values of x, x , , and s forthe two types of funds.b. Construct a comparative boxplot for the two types offunds, and comment on interesting features.An analysis was conducted by the Statistics Consulting Center atVirginia Polytechnic Institute and State University in which acertain treatment was applied to a set of tree stumps. The chemicalGarlon was used the with the purpose of regenerating the roots ofthe stumps. A spray was used with four levels of GarlonPage 23 of 23concentration. After a period of time the height of the shoots wasobserved. Does the concentration of Garlon has a significantimpact on the height of the shoots? Use α = 0.05.Here is a dataset containing plant growth measurements of plants grown in solutions of commonly-found chemicals in roadway runoff.Phragmites australis, a fast-growing non-native grass common to roadsides and disturbed wetlands of Tidewater Virginia, was grown in a greenhouse and watered with either: Distilled water (control); A weak petroleum solution (representing standard roadway runoff); Sodium chloride solution; Magnesium chloride solution; De-icing brine (50% sodium chloride and 50% magnesium chloride).Twenty grass preparations were used for each solution, and total growth (in cm) was recorded after watering every other day for 40 days.-Perform the correct statistical test to determine the p-value.-Report your answer rounded to four decimal places.-You should use formulas, functions, and the Data Analysis ToolPak in MS Excel to avoid additive rounding errors. Here are some useful functions: =t.test(array1,array2,tails,type) Produces a p-value for any…
- 1)In a cross-tabulation or contingency table examining the relationship between breed of dog and whether the dog passed certification to become a service animal, it is found that, overrall, 62 percent of the dogs were certified. The data looked at this for 6 breeds of dogs. If breed and being certified are independent of each other, about what percentage of each breed would pass the test? 2)Which of the following features must be present in a research design if the researchers want their data to demonstrate a causal relationship? The cause must take place before the effect. To the extent possible, another variable that explains the relationship needs to be ruled out or accounted for. The two variables need to covary. These three features must all be present. O A and B A correlation coefficient r provides two pieces of information about a relationship between two variables. These are Strength; direction of relationship Direction, proportionsFifteen adult males between the ages of 35 and 50 participated in a study to evaluate the effect of diet and exercise on blood cholesterol levels. The total cholesterol was measured in each subject initially and then three months after participating in an aerobic exercise program and switching to a low-fat diet. The data are shown in the following table.Suppose a researcher believes that the occurrence of natural disasters such as earthquakes leads to increased activity in the construction industry. he decides to collect province-level data on employment in the construction industry of an earthquake-prone country, like Japan, and regress this variable on an indicator variable that equals 1 if an earthquake took place in that province in the last five years. a. Should the researcher include province fixed effects in order to control for location specific characteristics of the labor market? b. What can the researcher to control for the location effects?
- An article reported data from a study in which both a baseline gasoline mixture and a reformulated gasoline were used. Consider the following observations on age (yr) and NOx emissions (g/kWh): Engine 1 2 3 4 5 6 7 8 9 10 Age 0 0 2 11 7 16 9 0 12 4 Baseline 1.74 4.38 4.04 1.23 5.30 0.58 3.35 3.44 0.73 1.23 Reformulated 1.85 5.93 5.52 2.67 6.54 0.76 4.94 4.87 0.69 1.39 Construct scatter plots of the baseline NOx emissions versus age. Construct scatter plots of the reformulated NOx emissions versus age. What appears to be the nature of the relationship between these two variables? As age increases, emissions also increase.As age increases, emissions decrease. There is no compelling relationship between the data.A study was conducted to assess the impact of nutrient enrichment on zooplankton densities in A & B Islands. An ecologist sampled populations of zooplankton in these two locations and observed the nutrient enrichment level was higher in A island when compared with the level in B island. It is predicted the zooplankton densities in A island will be greater than those found in B island.A company has two chemist, Mr. Morris and Mr. Logan to produce their drinks. Mr. John, their boss, is not pleased with Mr. Logan’s attitude to work, so he is contemplating firing Mr. Logan andkeeping Mr. Morris only to perform this job. The problem, however, is that Mr. Logan seems to produce a higher quality drink whenever he oversees production when compared to Mr. Morris. Before making a final decision, Mr. John decided to collect data measuring the quality of different batches ofdrinks produced by Mr. Morris and Mr. Logan to make a better-informeddecision. The results, measured on a quality scale, are listed below: Name Average Standard Deviation Sample Size Mr. Logan 98 1 8 Mr. Morris 94 4 10 a) Based on this data above, advise Mr. John whether Mr. Logan isbetter at making the signature sauce than Mr. Morris by usinghypothesis testing – use the critical value approach with a level ofsignificance at 5%.