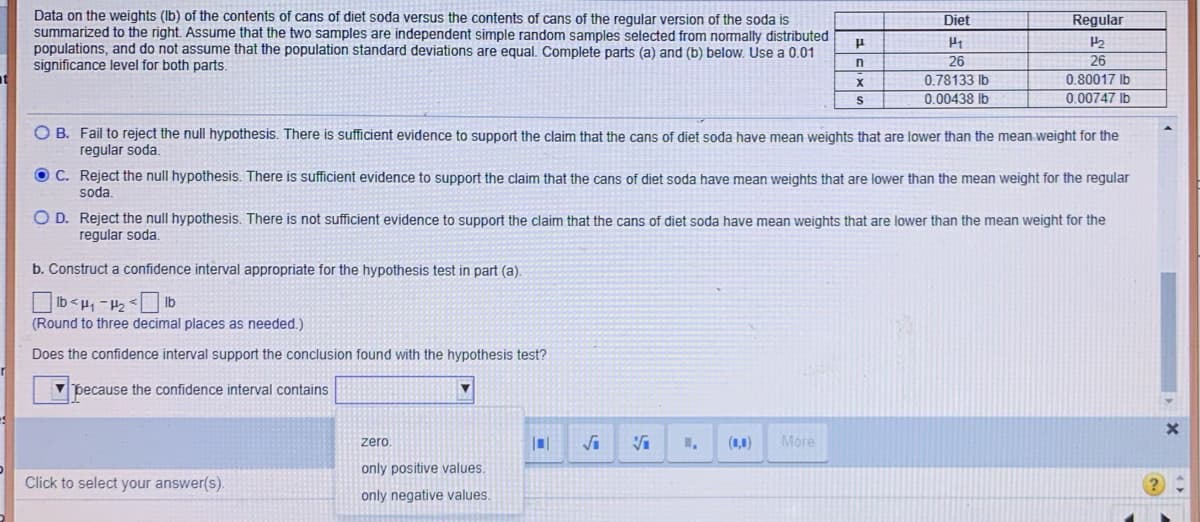
Data on the weights (Ib) of the contents of cans of diet soda versus the contents of cans of the regular version of the soda is summarized to the right. Assume that the two samples are independent simple random samples selected from normally distributed populations, and do not assume that the population standard deviations are equal. Complete parts (a) and (b) below. Use a 0.01 significance level for both parts. Diet Regular P2 26 26 0.78133 Ib 0.80017 Ib 0.00438 lb 0.00747 Ib O B. Fail to reject the null hypothesis. There is sufficient evidence to support the claim that the cans of diet soda have mean weights that are lower than the mean weight for the regular soda. O C. Reject the null hypothesis. There is sufficient evidence to support the claim that the cans of diet soda have mean weights that are lower than the mean weight for the regular soda. O D. Reject the null hypothesis. There is not sufficient evidence to support the claim that the cans of diet soda have mean weights that are lower than the mean weight for the regular soda. b. Construct a confidence interval appropriate for the hypothesis test in part (a). Ib (Round to three decimal places as needed.) Does the confidence interval support the conclusion found with the hypothesis test? because the confidence interval contains zero. (1,0) More only positive values. Click to select your answer(s). only negative values.

MATLAB: An Introduction with Applications
6th Edition
ISBN:9781119256830
Author:Amos Gilat
Publisher:Amos Gilat
Chapter1: Starting With Matlab
Section: Chapter Questions
Problem 1P
icon
Related questions
icon
Concept explainers
Topic Video
Question
I’m having trouble finding the test statistics as well.
Data on the weights (Ib) of the contents of cans of diet soda versus the contents of cans of the reqular version of the soda is
summarized to the right. Assume that the two samples are independent simple random samples selected from normally distributed
populations, and do not assume that the population standard deviations are equal. Complete parts (a) and (b) below. Use a 0.01
significance level for both parts.
Diet
Regular
26
26
0.78133 Ib
0.00438 Ib
0.80017 Ib
0.00747 Ib
O B. Fail to reject the null hypothesis. There is sufficient evidence to support the claim that the cans of diet soda have mean weights that are lower than the mean weight for the
regular soda.
O C. Reject the null hypothesis. There is sufficient evidence to support the claim that the cans of diet soda have mean weights that are lower than the mean weight for the regular
soda.
O D. Reject the null hypothesis. There is not sufficient evidence to support the claim that the cans of diet soda have mean weights that are lower than the mean weight for the
regular soda.
b. Construct a confidence interval appropriate for the hypothesis test in part (a).
qi> 21 – 'rl > qi
(Round to three decimal places as needed.)
Does the confidence interval support the conclusion found with the hypothesis test?
V þecause the confidence interval contains
zero
(1,0)
More
only positive values.
Click to select your answer(s).
only negative values.
Transcribed Image Text:Data on the weights (Ib) of the contents of cans of diet soda versus the contents of cans of the reqular version of the soda is summarized to the right. Assume that the two samples are independent simple random samples selected from normally distributed populations, and do not assume that the population standard deviations are equal. Complete parts (a) and (b) below. Use a 0.01 significance level for both parts. Diet Regular 26 26 0.78133 Ib 0.00438 Ib 0.80017 Ib 0.00747 Ib O B. Fail to reject the null hypothesis. There is sufficient evidence to support the claim that the cans of diet soda have mean weights that are lower than the mean weight for the regular soda. O C. Reject the null hypothesis. There is sufficient evidence to support the claim that the cans of diet soda have mean weights that are lower than the mean weight for the regular soda. O D. Reject the null hypothesis. There is not sufficient evidence to support the claim that the cans of diet soda have mean weights that are lower than the mean weight for the regular soda. b. Construct a confidence interval appropriate for the hypothesis test in part (a). qi> 21 – 'rl > qi (Round to three decimal places as needed.) Does the confidence interval support the conclusion found with the hypothesis test? V þecause the confidence interval contains zero (1,0) More only positive values. Click to select your answer(s). only negative values.
Expert Solution
steps

Step by step

Solved in 5 steps with 4 images

Blurred answer
Knowledge Booster
Centre, Spread, and Shape of a Distribution
Learn more about
Need a deep-dive on the concept behind this application? Look no further. Learn more about this topic, statistics and related others by exploring similar questions and additional content below.
Recommended textbooks for you
MATLAB: An Introduction with Applications
Statistics
ISBN:
9781119256830
Author:
Amos Gilat
Publisher:
John Wiley & Sons Inc
Probability and Statistics for Engineering and th…
Statistics
ISBN:
9781305251809
Author:
Jay L. Devore
Publisher:
Cengage Learning
Statistics for The Behavioral Sciences (MindTap C…
Statistics
ISBN:
9781305504912
Author:
Frederick J Gravetter, Larry B. Wallnau
Publisher:
Cengage Learning
Elementary Statistics: Picturing the World (7th E…
Statistics
ISBN:
9780134683416
Author:
Ron Larson, Betsy Farber
Publisher:
PEARSON
The Basic Practice of Statistics
Statistics
ISBN:
9781319042578
Author:
David S. Moore, William I. Notz, Michael A. Fligner
Publisher:
W. H. Freeman
Introduction to the Practice of Statistics
Statistics
ISBN:
9781319013387
Author:
David S. Moore, George P. McCabe, Bruce A. Craig
Publisher:
W. H. Freeman