Data show that men between the ages of 20 and 29 in a general population have a mean height of 69.3 inches, with a standard deviation of 3.2 inches. A baseball analyst wonders whether the standard deviation of heights of major-league baseball players is less than 3.2 inches. The heights (in inches) of 20 randomly selected players are shown in the table. E Click the icon to view the data table. C Test the notion at the a = 0.10 level of significance. What are the correct hypotheses for this test? Data table The null hypothesis is Hg: o = 3.2. The alternative hypothesis is H,: o < 3.2 Calculate the value of the test statistic. 71 76 76 72 72 70 73 74 74 z2= (Round to three decimal places as needed.) 74
Data show that men between the ages of 20 and 29 in a general population have a mean height of 69.3 inches, with a standard deviation of 3.2 inches. A baseball analyst wonders whether the standard deviation of heights of major-league baseball players is less than 3.2 inches. The heights (in inches) of 20 randomly selected players are shown in the table. E Click the icon to view the data table. C Test the notion at the a = 0.10 level of significance. What are the correct hypotheses for this test? Data table The null hypothesis is Hg: o = 3.2. The alternative hypothesis is H,: o < 3.2 Calculate the value of the test statistic. 71 76 76 72 72 70 73 74 74 z2= (Round to three decimal places as needed.) 74

MATLAB: An Introduction with Applications
6th Edition
ISBN:9781119256830
Author:Amos Gilat
Publisher:Amos Gilat
Chapter1: Starting With Matlab
Section: Chapter Questions
Problem 1P

Related questions
Question
(2)
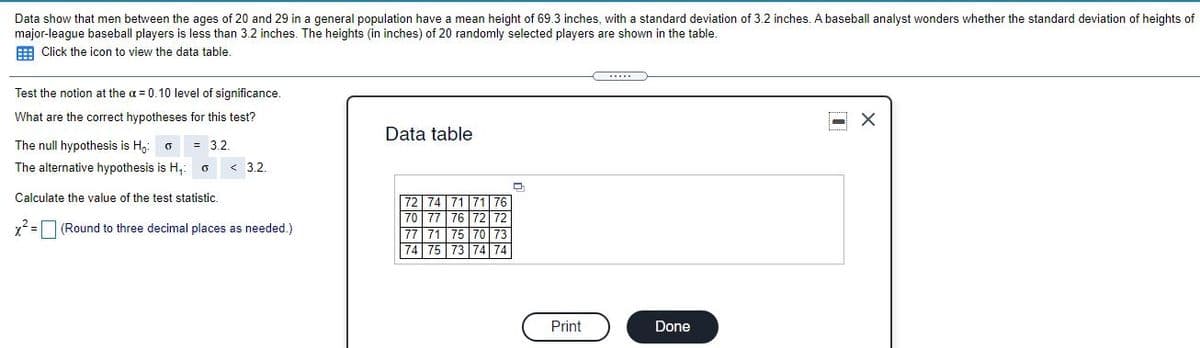
Transcribed Image Text:Data show that men between the ages of 20 and 29 in a general population have a mean height of 69.3 inches, with a standard deviation of 3.2 inches. A baseball analyst wonders whether the standard deviation of heights of
major-league baseball players is less than 3.2 inches. The heights (in inches) of 20 randomly selected players are shown in the table.
E Click the icon to view the data table.
..
Test the notion at the a = 0.10 level of significance.
What are the correct hypotheses for this test?
Data table
The null hypothesis is Hg: o
= 3.2.
The alternative hypothesis is H,: o
< 3.2.
Calculate the value of the test statistic.
72 74
70 77
76
72
72
x2 = (Round to three decimal places as needed.)
77| 71
75
70
73
74 75 73
74
74
Print
Done
Expert Solution
This question has been solved!
Explore an expertly crafted, step-by-step solution for a thorough understanding of key concepts.

This is a popular solution!

Trending now
This is a popular solution!

Step by step
Solved in 3 steps

Recommended textbooks for you
MATLAB: An Introduction with Applications
Statistics
ISBN:
9781119256830
Author:
Amos Gilat
Publisher:
John Wiley & Sons Inc

Probability and Statistics for Engineering and th…
Statistics
ISBN:
9781305251809
Author:
Jay L. Devore
Publisher:
Cengage Learning

Statistics for The Behavioral Sciences (MindTap C…
Statistics
ISBN:
9781305504912
Author:
Frederick J Gravetter, Larry B. Wallnau
Publisher:
Cengage Learning
MATLAB: An Introduction with Applications
Statistics
ISBN:
9781119256830
Author:
Amos Gilat
Publisher:
John Wiley & Sons Inc
Probability and Statistics for Engineering and th…
Statistics
ISBN:
9781305251809
Author:
Jay L. Devore
Publisher:
Cengage Learning
Statistics for The Behavioral Sciences (MindTap C…
Statistics
ISBN:
9781305504912
Author:
Frederick J Gravetter, Larry B. Wallnau
Publisher:
Cengage Learning

Elementary Statistics: Picturing the World (7th E…
Statistics
ISBN:
9780134683416
Author:
Ron Larson, Betsy Farber
Publisher:
PEARSON

The Basic Practice of Statistics
Statistics
ISBN:
9781319042578
Author:
David S. Moore, William I. Notz, Michael A. Fligner
Publisher:
W. H. Freeman

Introduction to the Practice of Statistics
Statistics
ISBN:
9781319013387
Author:
David S. Moore, George P. McCabe, Bruce A. Craig
Publisher:
W. H. Freeman