Data show that men between the ages of 20 and 29 in a general population have a mean height of 69.3 inches, with a standard deviation of 3.1 inches. A baseball analyst wonders whether the standard deviation of heights of major-league baseball players is less than 3.1 inches. The heights (in inches) of 20 randomly selected players are shown in the table. E Click the icon to view the data table. Test the notion at the a0.10 level of significance. What are the correct hypotheses for this test? Data table The null hypothesis is H 3.1. The altemative hypothesis is H,: V3.1. 72 74 71 73 76 70 77 76 72 72 77 72 75 70 73 74 75 73 74 73
Data show that men between the ages of 20 and 29 in a general population have a mean height of 69.3 inches, with a standard deviation of 3.1 inches. A baseball analyst wonders whether the standard deviation of heights of major-league baseball players is less than 3.1 inches. The heights (in inches) of 20 randomly selected players are shown in the table. E Click the icon to view the data table. Test the notion at the a0.10 level of significance. What are the correct hypotheses for this test? Data table The null hypothesis is H 3.1. The altemative hypothesis is H,: V3.1. 72 74 71 73 76 70 77 76 72 72 77 72 75 70 73 74 75 73 74 73

Glencoe Algebra 1, Student Edition, 9780079039897, 0079039898, 2018
18th Edition
ISBN:9780079039897
Author:Carter
Publisher:Carter
Chapter10: Statistics
Section10.3: Measures Of Spread
Problem 14PPS

Related questions
Question
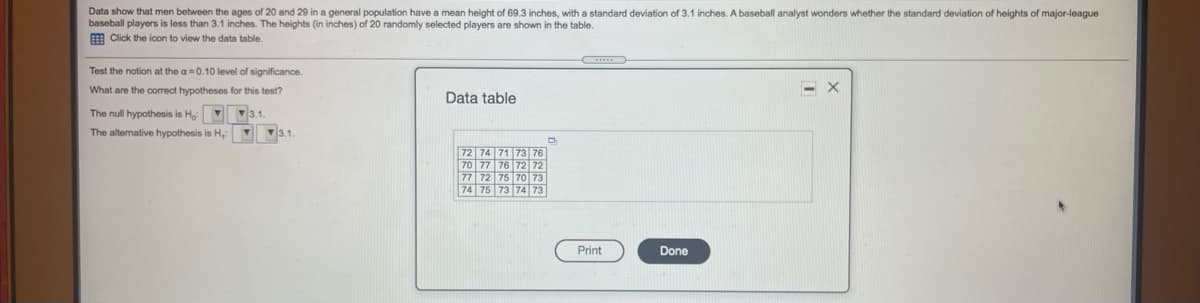
Transcribed Image Text:Data show that men between the ages of 20 and 29 in a general population have a mean height of 69.3 inches, with a standard deviation of 3.1 inches. A baseball analyst wonders whether the standard deviation of heights of major-league
baseball players is less than 3.1 inches. The heights (in inches) of 20 randomly selected players are shown in the table.
E Click the icon to view the data table.
Test the notion at the a 0.10 level of significance.
What are the correct hypotheses for this test?
- X
Data table
The null hypothesis is H
3.1.
The altemative hypothesis is H,
V 3.1.
72 74 71 73 76
70 77 76 72 72
77 72 75 70 73
74 75 73 74 73
Print
Done
Expert Solution
This question has been solved!
Explore an expertly crafted, step-by-step solution for a thorough understanding of key concepts.

This is a popular solution!

Trending now
This is a popular solution!

Step by step
Solved in 2 steps

Recommended textbooks for you
Glencoe Algebra 1, Student Edition, 9780079039897…
Algebra
ISBN:
9780079039897
Author:
Carter
Publisher:
McGraw Hill

Big Ideas Math A Bridge To Success Algebra 1: Stu…
Algebra
ISBN:
9781680331141
Author:
HOUGHTON MIFFLIN HARCOURT
Publisher:
Houghton Mifflin Harcourt
Glencoe Algebra 1, Student Edition, 9780079039897…
Algebra
ISBN:
9780079039897
Author:
Carter
Publisher:
McGraw Hill
Big Ideas Math A Bridge To Success Algebra 1: Stu…
Algebra
ISBN:
9781680331141
Author:
HOUGHTON MIFFLIN HARCOURT
Publisher:
Houghton Mifflin Harcourt