Data show that men between the ages of 20 and 29 in a general population have a mean height of 69.3 inches, with a standard deviation of 3.2 inches. A baseball analyst wonders whether the standard deviation of heights of major-league baseball players is less than 3.2 inches. The heights (in inches) of 20 randomly selected players are shown in the table. E Click the icon to view the data table. Test the notion at the a = 0.01 level of significance. What are the correct hypotheses for this test? The null hypothesis is Ho: o = 3.2. The alternative hypothesis is H,: < 3.2. Data table Calculate the value of the test statistic. x2 = (Round to three decimal places as needed.) 72 74 71 71 76 70 77 76 72 72 77 | 71 | 7570 74 75 73 73 4 74
Data show that men between the ages of 20 and 29 in a general population have a mean height of 69.3 inches, with a standard deviation of 3.2 inches. A baseball analyst wonders whether the standard deviation of heights of major-league baseball players is less than 3.2 inches. The heights (in inches) of 20 randomly selected players are shown in the table. E Click the icon to view the data table. Test the notion at the a = 0.01 level of significance. What are the correct hypotheses for this test? The null hypothesis is Ho: o = 3.2. The alternative hypothesis is H,: < 3.2. Data table Calculate the value of the test statistic. x2 = (Round to three decimal places as needed.) 72 74 71 71 76 70 77 76 72 72 77 | 71 | 7570 74 75 73 73 4 74

MATLAB: An Introduction with Applications
6th Edition
ISBN:9781119256830
Author:Amos Gilat
Publisher:Amos Gilat
Chapter1: Starting With Matlab
Section: Chapter Questions
Problem 1P

Related questions
Question
Find Test Statistic, P value, and Z score.
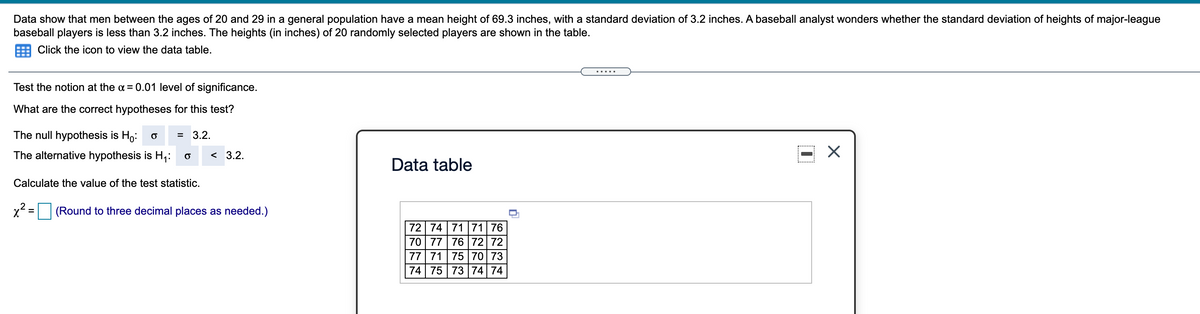
Transcribed Image Text:Data show that men between the ages of 20 and 29 in a general population have a mean height of 69.3 inches, with a standard deviation of 3.2 inches. A baseball analyst wonders whether the standard deviation of heights of major-league
baseball players is less than 3.2 inches. The heights (in inches) of 20 randomly selected players are shown in the table.
Click the icon to view the data table.
.... .
Test the notion at the a = 0.01 level of significance.
What are the correct hypotheses for this test?
The null hypothesis is Ho:
= 3.2.
The alternative hypothesis is H,:
< 3.2.
Data table
Calculate the value of the test statistic.
(Round to three decimal places as needed.)
%3D
72 74 71 71 76
70 77 76 72 72
77 71 75 70 73
74 75 73 74 74
Expert Solution
This question has been solved!
Explore an expertly crafted, step-by-step solution for a thorough understanding of key concepts.

This is a popular solution!

Trending now
This is a popular solution!

Step by step
Solved in 5 steps with 17 images

Recommended textbooks for you
MATLAB: An Introduction with Applications
Statistics
ISBN:
9781119256830
Author:
Amos Gilat
Publisher:
John Wiley & Sons Inc

Probability and Statistics for Engineering and th…
Statistics
ISBN:
9781305251809
Author:
Jay L. Devore
Publisher:
Cengage Learning

Statistics for The Behavioral Sciences (MindTap C…
Statistics
ISBN:
9781305504912
Author:
Frederick J Gravetter, Larry B. Wallnau
Publisher:
Cengage Learning
MATLAB: An Introduction with Applications
Statistics
ISBN:
9781119256830
Author:
Amos Gilat
Publisher:
John Wiley & Sons Inc
Probability and Statistics for Engineering and th…
Statistics
ISBN:
9781305251809
Author:
Jay L. Devore
Publisher:
Cengage Learning
Statistics for The Behavioral Sciences (MindTap C…
Statistics
ISBN:
9781305504912
Author:
Frederick J Gravetter, Larry B. Wallnau
Publisher:
Cengage Learning

Elementary Statistics: Picturing the World (7th E…
Statistics
ISBN:
9780134683416
Author:
Ron Larson, Betsy Farber
Publisher:
PEARSON

The Basic Practice of Statistics
Statistics
ISBN:
9781319042578
Author:
David S. Moore, William I. Notz, Michael A. Fligner
Publisher:
W. H. Freeman

Introduction to the Practice of Statistics
Statistics
ISBN:
9781319013387
Author:
David S. Moore, George P. McCabe, Bruce A. Craig
Publisher:
W. H. Freeman