Data was collected to explain an employee’s annual income raise (expressed in $’s) based on the employee’s rating (on a scale of 1-20) Based on the regression results, answer the following questions a) What is the estimated regression equation? b) What percentage of the variation in raises is explained by rating? c) What is the correlation between rating and raise?
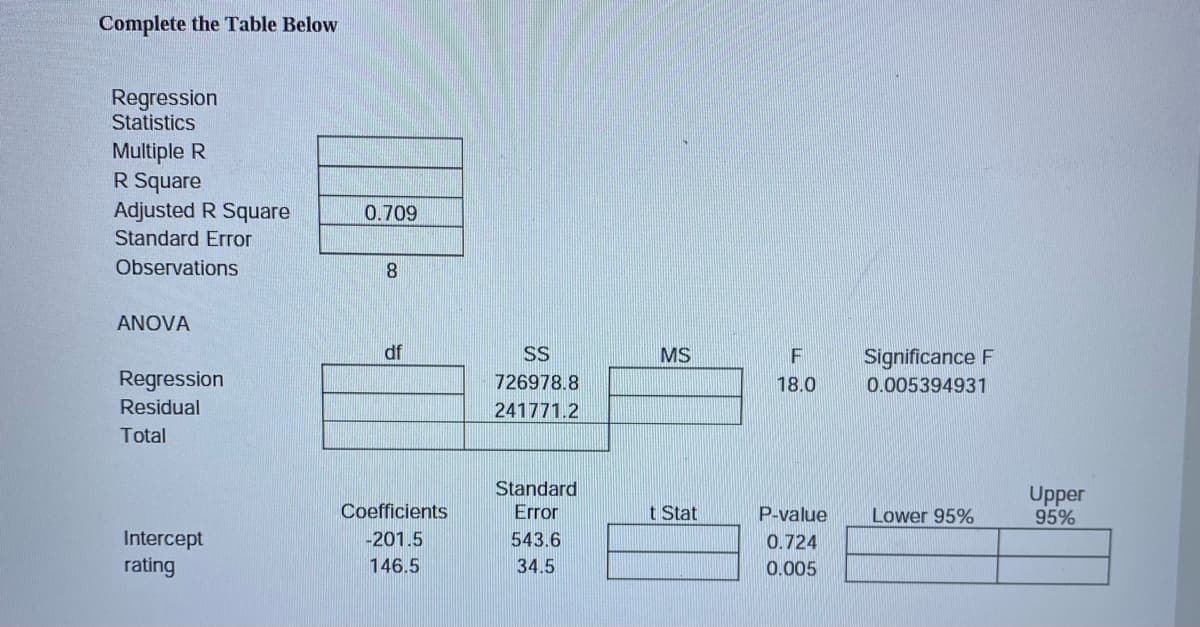
Q: From a lot of 10 items containing 3 defectives, a sample of 4 items is drawn a random. Let the…
A:
Q: Men
A:
Q: 1. As of August 12, 2021, these are the countries with confirmed COVID-19 cases ranging from one to…
A: Given as of August 12, 2021 these are the countries with the confirmed COVID 19 cases. First we will…
Q: Medical researchers have developed a new artificial heart constructed primarily of titanium and…
A:
Q: Thirty-two small communities in Connecticut (population near 10,000 each) gave an average of x =…
A: Given Information: Sample size n=32 Sample mean x¯=139.5 Population standard deviation σ=44.5
Q: A professional racing team is holding tryouts at its test track. The team requires its drivers to…
A: The hypothesized mean is 133.
Q: μ = Population mean = o = Population standard deviation = sure to enter the population standard…
A: From the given information we find the solution.
Q: Consider the following election. Number of Voters 16 11 12 4 1st Choice B D A B 2nd Choice A A D D…
A: Plurality method is the type of method that used to decide the election result. In the plurality…
Q: In a random sample of 500 children from Illinois, 143 were undernourished. Use these sample data to…
A: Given: N = 500 X = 143 Margin of error E = 5% = 0.05 Formula Used: Sample size n = Z2×p(1-p)E2
Q: Population values: 2, 4, 6 μ = Population mean = o = Population standard deviation = (Round to tv…
A: Given data,The population values are 2,4,6
Q: 2.84 The probability that the head of a household is home when a telemarketing representative calls…
A: Givenprobability that the head of a household is home when a telemarketing representative calls =…
Q: Which of the following samples taken from the sample 10, 20, 30, 40, 50 could be a bootstrap sample?…
A: * SOLUTION :-
Q: The bottled beverage industry will use robots to fill drinks in bottles containing 1000 ml. There…
A: We have given that µ1 = the average spill from robot A, µ2 = the average from robot B, then the…
Q: A UFC fighter has landed 1044 significant strikes in his previous 12 UFC fights. Assume that the…
A: It is given that the population standard deviation is 10.
Q: The average amount of money spent for lunch per person in the college cafeteria is $6.24 and the…
A:
Q: Assume that a sample is used to estimate a population proportion p. Find the 95% confidence interval…
A:
Q: Give three (3) examples for each where the Two-Sample t-Test and Paired-Samples t-Test were misused…
A: Two-sample t-test is used to compare the means between two independent groups and paired t-test is…
Q: 5. In 1960, census results indicated that the age at which American men first married had a mean of…
A: Since you have posted a question with multiple subparts, we will solve first three subparts for you.…
Q: 1. As of August 12, 2021, these are the countries with confirmed COVID-19 cases ranging from one to…
A: Measures of central tendency A measure of central tendency (also named as measures of center or…
Q: What is the maximum error one can expect to make with probability 0.90 when using the mean of a…
A:
Q: The Hodge Office Supply Company makes pins that are packaged and sold in bags. There is an accepted…
A: The question is about quality control Given : Designed net weight of bags of pins = 7 oz Accepted…
Q: The amount of pollutants that are found in waterways near large cities is normally distributed with…
A:
Q: A study was made by a retail merchant to determine the relation between weekly advertising…
A: The following data has been given: Advertising Costs (x) Sales (y) 40 385 20 400 25 395…
Q: Identify the sample space of the probability experiment and determine the number of outcomes in the…
A: We have to find total outcome and sample space for Guessing the first digit in the price of a car.…
Q: A sample of 10 cam shafts intended for use in gasoline engines has an average eccentricity of 1.02…
A: Given data n=10 mean=1.02 standard deviation=0.044
Q: A certain brand of automobile tire has a mean life span of 37,000 miles and a standard deviation of…
A: According to our policy we can answer only first three part for remaining please repost the…
Q: A researcher wants to know how long it takes, on average, for a certain species of bacteria to…
A: The times of 19 cells to divide, are given.
Q: What is the range of the median time spent running? OA. 80-89 minutes OB. 90-99 minutes 70 70
A: Given that a histogram number of team members versus time.
Q: The owner of a chain of mini-markets wants to compare the sales performance of two of her stores,…
A: Claim : the owner conclude that the mean daily sales of the two stores differ
Q: A certain method was performed on a reference material. The method has a low RSD, but high relative…
A: Given: A method was performed on a reference material. The method has a low RSD, but high relative…
Q: Assume that the Young’s modulus measurements of an aluminum piece produced by a casting process…
A: Given Population mean μ=74, standard deviations σ=155 Note: According to Bartleby guidelines expert…
Q: P is a probability function defined on the power set of a sample space S. Then (i) P() = 0, (ii)…
A:
Q: sample?
A: Bootstrap Sampling: It is a highly used technique in statistics in machine learning, It is basically…
Q: A janitor at a large office building believes that his supply of light bulbs has a defect rate that…
A:
Q: (a) A sample of test scores is obtained. The scores are displayed as follows: 11, 16, 19, 15, 7, 8,…
A: Confidence interval is the interval where true value of parameter can occur. It has two parts, they…
Q: A computer manufacturer is interested in comparing assembly times for two keyboard assembly…
A: Claim : the company conclude that the mean assembly time for Process 2 exceeds that of Process 1
Q: A paper manufacturer has a production process that operates continuously throughout an entire…
A: Solution The paper is expected to have a mean length of8inches, and the standard deviation of the…
Q: Consider 2 variables X and Y. The data for X has a mean of 10 and standard deviation of 3. The data…
A: From the given information, sX=3, sY=6, and r=-0.4.
Q: A survey was conducted that asked 1019 people how many books they had read in the past year. Results…
A:
Q: The amount of time required per individual at a bank teller's window has been found to be…
A: Given,mean(μ)=130 secstandard deviation(σ)=45 sec
Q: If the probability that a man aged 60 will live to be 70 is 0.65, what is the probability that out…
A: Given n=10 P=0.65
Q: A nationwide test taken by high school sophomores and juniors has three sections, each scored on a…
A: From given information, score scale is 20 to 80. National mean score was 49.4 with a standard…
Q: Statistics Bottling Company Case Study Imagine you are a manager at a major bottling company.…
A: Since you have posted a question with multiple sub-parts, we will solve first 3 sub-parts for you.…
Q: amie has just completed her second semester in college. She earned a grade of A in her 1-hour…
A:
Q: Question 6 Karen wants to advertise how many chocolate chips are in each Big Chip cookie at her…
A: Given x-bar=6.1 n=81 Standard deviations=1.6
Q: s. Two of these have been given an experimental modification. In the first week after this…
A: Given: Factory has 52 machines.
Q: As of August 12, 2021, these are the countries with confirmed COVID-19 cases ranging from one to…
A: Frequency table for confirmed cases of the countries Confirmed cases(x) No. of countries 0-50…
Q: 1. As of August 12, 2021, these are the countries with confirmed COVID-19 cases ranging from one to…
A: Measures of central tendency A measure of central tendency (also named as measures of center…
Q: bootstrap
A: Bootstrap sample: A sample that is made by the repeated draw of smaller sample from an original…
Q: A psychologist is interested in constructing a 95% confidence interval for the proportion of people…
A: Given data,No of people n=715people who agreed to survey is x=73Construct a 95% CI?
Step by step
Solved in 5 steps
- The highway department wants to estimate the proportion of vehicles on a Toll road at KM 25 between midnight and 5:00 A.M. The department head wanted to see how many 18-wheel tractor trailers passed along the road. These estimates will be used to determine road improvement and construction considerations and in road patrol planning. The department head asked researchers to calculate the estimated vehicles at different locations on the inter-island road over the past 7 days. Of the 3,481 vehicles counted, 927 were 18 wheelers. However, out of a total of 927, there were 74 who had accidents, so the sample was calculated based on the results of reducing the number of accidents. Determine the point estimate for the proportion of vehicles traveling on KM 25 during this time period which are 18 wheelers! (Assume the confidence level is 99%). What is the benefit of estimating the estimated value in this case (analyze the answers you have obtained)?According to the National Center for Health Statistics, in the United States mothers who live in poverty generally have babies with lower birthweight than those who do not live in poverty. While the average birthweight for babies born in the U.S. is approximately 3300 grams, the average birthweight for women living in poverty is 2800 grams. A hospital introduced a prenatal care program to address this problem and enrolled 25 mothers who live in poverty. Babies born to these women had a mean birthweight of 3075g with a standard deviation of 500g. Is the program effective in improving the birthweight of babies born to poor mothers? Assume α = 0.05. Which mean do I use to create my null hypothesis and alternative hypothesis? is this a right-tailed test?Which would be the most effective method to determine if the mean diameter of the suppliers products is not more than 5 centimeters
- In a 4 point grade system, an A is worth 4 points, a B is worth 3 points, a C is worth 2 points and a D is worth 1 point. No points are awarded for an F. Last semester Tanya received a B in a 4 credit hour course, an A in a three credit hour course, a C in a three credit hour course, and an A in another three credit hour course. Grade point average (GPA) is calculated as a weighted average using the credit hours as weights and the number of points corresponding to the grades as pieces of data. Calculate Tanya's GPA for the previous semester. Round your answer to the nearest hundredth and explain in complete sentences your process. Show all work.A manager of a large corporation recommends a $10,000 raise be given to keep a valuedsubordinate from moving to another company. What internal and external sources of datamight be used to decide whether such a salary increase is appropriate?A lecturer at WIN wanted to know if he can predict student’s quiz results by asking them to complete a simple survey. The result of the survey is found in the file: Assignment 2 sem22020 data set 1.Quiz ResultActual Mark (0-15) for quiz student attainedEQRQuiz score (0-15) expected to get before taking the quizStudy Hrs.Number of hours per week (on average) spent studying for StatisticsAgeAge (in years)BBTSatisfaction rating of Big Bang TheorySexM=1 F=0MBMB=1 for good math background, otherwise 0MCMC= 1 if math centre is used regularly, otherwise 0AuHSAuHS = 1 if student completed high school in Australia, otherwise 0LMLM=1 if student likes math, 0 otherwiseTask 1: Variable List(a) Using the variables listed in the table above, Describe each variable.(b) State for each variable whether it is qualitative or quantitative; if it is qualitative, state whether it is nominal or ordinal, and if it is quantitative, state whether it is discrete or continuous.Task 2: HistogramCreate a histogram…
- To the Internal Revenue Service (IRS), the reasonableness of total itemized deductions depends on the taxpayer’s adjusted gross income. Large deductions, which include charity and medical deductions, are more reasonable for taxpayers with large adjusted gross incomes. If a taxpayer claims larger than average itemized deductions for a given level of income, the chances of an IRS audit are increased. Data (in thousands of dollars) on Adjusted Gross Income (AGI) and the Reasonable Amount of Itemized Deductions (RAID) are as follows: AGI : 22, 27, 32, 48, 65, 85, 120 RAID : 9.6, 9.6, 10.1, 11.1, 13.5, 17.7, 25.5 The correct interpretation of the meaning of each of the coefficients in the linear model is: a. When AGI is zero, the RAID is $4680 in this linear model. Since x = 0 is not included in the sample values of the independent variable, this interpretation cannot be a meaningful one. For every one thousand dollar of the AGI, the RAID increases by $161 in this linear model.…To the Internal Revenue Service (IRS), the reasonableness of total itemized deductions depends on the taxpayer’s adjusted gross income. Large deductions, which include charity and medical deductions, are more reasonable for taxpayers with large adjusted gross incomes. If a taxpayer claims larger than average itemized deductions for a given level of income, the chances of an IRS audit are increased. Data (in thousands of dollars) on Adjusted Gross Income (AGI) and the Reasonable Amount of Itemized Deductions (RAID) are as follows: AGI : 22, 27, 32, 48, 65, 85, 120 RAID : 9.6, 9.6, 10.1, 11.1, 13.5, 17.7, 25.5 Examine the attached printout and answer the following questions. The correct interpretation of the meaning of each of the coefficients in the linear model is: a. When AGI is zero, the RAID is $4680 in this linear model. Since x = 0 is not included in the sample values of the independent variable, this interpretation cannot be a meaningful one. For every one…To the Internal Revenue Service (IRS), the reasonableness of total itemized deductions depends on the taxpayer’s adjusted gross income. Large deductions, which include charity and medical deductions, are more reasonable for taxpayers with large adjusted gross incomes. If a taxpayer claims larger than average itemized deductions for a given level of income, the chances of an IRS audit are increased. Data (in thousands of dollars) on Adjusted Gross Income (AGI) and the Reasonable Amount of Itemized Deductions (RAID) are as follows: a. When AGI is zero, the RAID is $4680 in this linear model. Since x = 0 is not included in the sample values of the independent variable, this interpretation cannot be a meaningful one. For every one thousand dollar of the AGI, the RAID increases by $161 in this linear model. b. When AGI is zero, the RAID is $4680 in this linear model. For every one thousand dollar of the AGI, the RAID increases by $161 in this linear model. c. When…
- To the Internal Revenue Service (IRS), the reasonableness of total itemized deductions depends on the taxpayer’s adjusted gross income. Large deductions, which include charity and medical deductions, are more reasonable for taxpayers with large adjusted gross incomes. If a taxpayer claims larger than average itemized deductions for a given level of income, the chances of an IRS audit are increased. Data (in thousands of dollars) on Adjusted Gross Income (AGI) and the Reasonable Amount of Itemized Deductions (RAID) are as follows: AGI : 22, 27, 32, 48, 65, 85, 120 RAID : 9.6, 9.6, 10.1, 11.1, 13.5, 17.7, 25.5 Examine the attached printout and answer the following questions. The correct interpretation of the meaning of each of the coefficients in the linear model is:An analysis was conducted by the Statistics Consulting Center atVirginia Polytechnic Institute and State University in which acertain treatment was applied to a set of tree stumps. The chemicalGarlon was used the with the purpose of regenerating the roots ofthe stumps. A spray was used with four levels of GarlonPage 23 of 23concentration. After a period of time the height of the shoots wasobserved. Does the concentration of Garlon has a significantimpact on the height of the shoots? Use α = 0.05.The department of education ran a very comprehensive study in the 1990's to determine the GPA of first generation college students (those who are the first in their family to go to college) in their freshman year. The mean GPA for first generation college students was stated in teh report to be 2.37 for males and 2.21 for females. In 2018, a consumer advocacy group is interested in whether the average GPA for first generation college females was still smaller than their male counterparts. Assume the GPA's are normally distributed. A. State the null hypothesis and the alternative hypothesis. Is the advocacy group interested in a one tail or two tail test (brief explanation)? B. Find the value of the test statistic and an associated p-value (or a range for teh p-value) if 25 males SAR yielded an average GPA 2.46 with a standard deviation of 0.16 and 25 females SAR yeilded an average GPA 2.39 with a standard deviation of 0.12. C. Determine if the test requires use of the Z table or…