Data were collected from a survey given to graduating college seniors on the number of times they had changed majors. From that data, a probability distribution was constructed. The random variable X is defined as the number of times a graduating senior changed majors. It is shown below: 1 4 7 8 P(X = x) 0.187 0.305 0.165 0.187 0.097 0.036 0.018 0.003 0.002 a. What is the probability that a randemly selected student changed his or her major at least once? b. What is the probability that a randomly selected student changed his or her major at most twice? c. Given that a randomly selected person did change majors, what is the probability that he or she changed majors more than three times?
Data were collected from a survey given to graduating college seniors on the number of times they had changed majors. From that data, a probability distribution was constructed. The random variable X is defined as the number of times a graduating senior changed majors. It is shown below: 1 4 7 8 P(X = x) 0.187 0.305 0.165 0.187 0.097 0.036 0.018 0.003 0.002 a. What is the probability that a randemly selected student changed his or her major at least once? b. What is the probability that a randomly selected student changed his or her major at most twice? c. Given that a randomly selected person did change majors, what is the probability that he or she changed majors more than three times?

College Algebra (MindTap Course List)
12th Edition
ISBN:9781305652231
Author:R. David Gustafson, Jeff Hughes
Publisher:R. David Gustafson, Jeff Hughes
Chapter8: Sequences, Series, And Probability
Section8.7: Probability
Problem 39E: Assume that the probability that an airplane engine will fail during a torture test is 12and that...

Related questions

Concept explainers
Contingency Table
A contingency table can be defined as the visual representation of the relationship between two or more categorical variables that can be evaluated and registered. It is a categorical version of the scatterplot, which is used to investigate the linear relationship between two variables. A contingency table is indeed a type of frequency distribution table that displays two variables at the same time.
Binomial Distribution
Binomial is an algebraic expression of the sum or the difference of two terms. Before knowing about binomial distribution, we must know about the binomial theorem.
Topic Video
Question
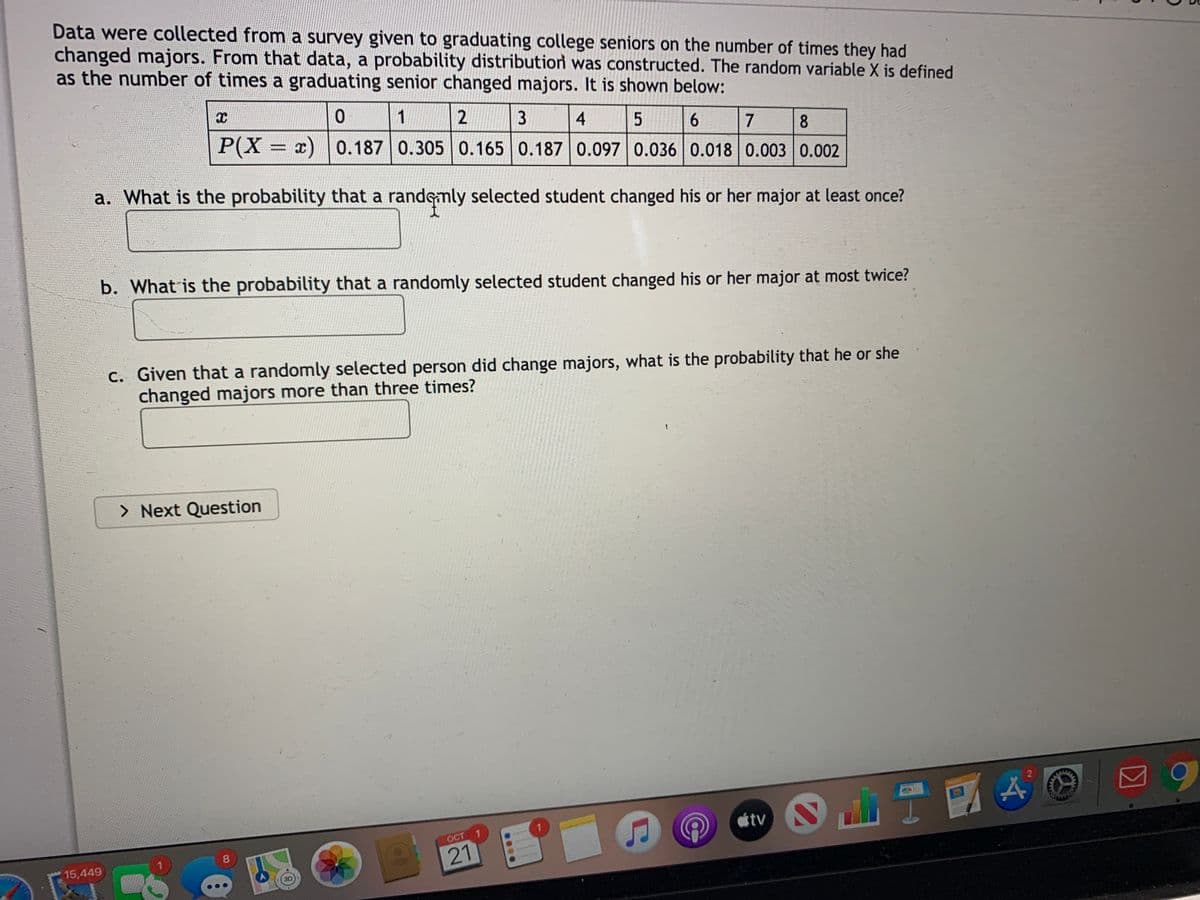
Transcribed Image Text:Data were collected from a survey given to graduating college seniors on the number of times they had
changed majors. From that data, a probability distributioni was constructed. The random variable X is defined
as the number of times a graduating senior changed majors. It is shown below:
1
4
6.
7
8
P(X = x) | 0.187 0.305 0.165 0.187 0.097 0.036 0.018 0.003 0.002
a. What is the probability that a randsmly selected student changed his or her major at least once?
b. What is the probability that a randomly selected student changed his or her major at most twice?
C. Given that a randomly selected person did change majors, what is the probability that he or she
changed majors more than three times?
> Next Question
AOES
tv
OCT 1
8.
21
15,449
....
Expert Solution
This question has been solved!
Explore an expertly crafted, step-by-step solution for a thorough understanding of key concepts.

This is a popular solution!

Trending now
This is a popular solution!

Step by step
Solved in 2 steps with 3 images

Knowledge Booster


Learn more about
Need a deep-dive on the concept behind this application? Look no further. Learn more about this topic, statistics and related others by exploring similar questions and additional content below.Recommended textbooks for you
College Algebra (MindTap Course List)
Algebra
ISBN:
9781305652231
Author:
R. David Gustafson, Jeff Hughes
Publisher:
Cengage Learning
College Algebra (MindTap Course List)
Algebra
ISBN:
9781305652231
Author:
R. David Gustafson, Jeff Hughes
Publisher:
Cengage Learning