Data were collected to explain the amount of a customer’s purchase (expressed in $’s) based on the amount of time the customer has spent on the company’s website (expressed in minutes) Based on the regression results, answer the following questions d) What is the standard error of the error term in the regression equation? e) Is the coefficient on the variable “time” statistically significantly different than 0 at the 5% level of significance? How do you know? f) What is the predicted purchase amount for a customer who has spent 30 minutes on the website?
Data were collected to explain the amount of a customer’s purchase (expressed in $’s) based on the amount of time the customer has spent on the company’s website (expressed in minutes) Based on the regression results, answer the following questions d) What is the standard error of the error term in the regression equation? e) Is the coefficient on the variable “time” statistically significantly different than 0 at the 5% level of significance? How do you know? f) What is the predicted purchase amount for a customer who has spent 30 minutes on the website?

Linear Algebra: A Modern Introduction
4th Edition
ISBN:9781285463247
Author:David Poole
Publisher:David Poole
Chapter4: Eigenvalues And Eigenvectors
Section4.6: Applications And The Perron-frobenius Theorem
Problem 26EQ

Related questions
Question
Data were collected to explain the amount of a customer’s purchase (expressed in $’s) based on the amount of time the customer has spent on the company’s website (expressed in minutes)
Based on the regression results, answer the following questions
d) What is the standard error of the error term in the regression equation?
e) Is the coefficient on the variable “time” statistically significantly different than 0 at the 5% level of significance? How do you know?
f) What is the predicted purchase amount for a customer who has spent 30 minutes on the website?
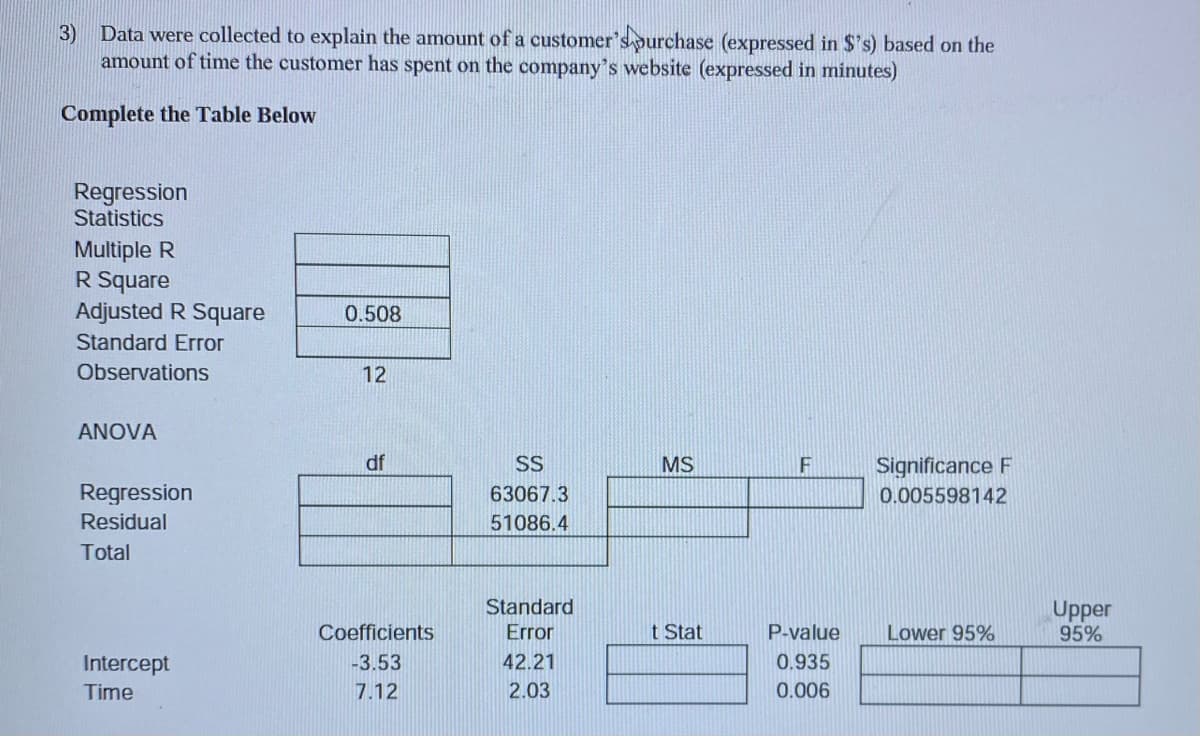
Transcribed Image Text:3)
Data were collected to explain the amount of a customer's ourchase (expressed in $'s) based on the
amount of time the customer has spent on the company's website (expressed in minutes)
Complete the Table Below
Regression
Statistics
Multiple R
R Square
Adjusted R Square
0.508
Standard Error
Observations
12
ANOVA
df
SS
MS
F
Significance F
Regression
63067.3
0.005598142
Residual
51086.4
Total
Standard
Error
Upper
95%
Coefficients
t Stat
P-value
Lower 95%
Intercept
-3.53
42.21
0.935
Time
7.12
2.03
0.006
Expert Solution
This question has been solved!
Explore an expertly crafted, step-by-step solution for a thorough understanding of key concepts.

Step by step
Solved in 2 steps

Recommended textbooks for you
Linear Algebra: A Modern Introduction
Algebra
ISBN:
9781285463247
Author:
David Poole
Publisher:
Cengage Learning

Mathematics For Machine Technology
Advanced Math
ISBN:
9781337798310
Author:
Peterson, John.
Publisher:
Cengage Learning,

College Algebra (MindTap Course List)
Algebra
ISBN:
9781305652231
Author:
R. David Gustafson, Jeff Hughes
Publisher:
Cengage Learning
Linear Algebra: A Modern Introduction
Algebra
ISBN:
9781285463247
Author:
David Poole
Publisher:
Cengage Learning
Mathematics For Machine Technology
Advanced Math
ISBN:
9781337798310
Author:
Peterson, John.
Publisher:
Cengage Learning,
College Algebra (MindTap Course List)
Algebra
ISBN:
9781305652231
Author:
R. David Gustafson, Jeff Hughes
Publisher:
Cengage Learning