Data were collected to explain the number of wins a major league baseball team has based on the earned run average (ERA) of the team’s starting pitchers g) What is the effect on wins of decreasing the ERA by 1 run?
Data were collected to explain the number of wins a major league baseball team has based on the earned run average (ERA) of the team’s starting pitchers g) What is the effect on wins of decreasing the ERA by 1 run?

MATLAB: An Introduction with Applications
6th Edition
ISBN:9781119256830
Author:Amos Gilat
Publisher:Amos Gilat
Chapter1: Starting With Matlab
Section: Chapter Questions
Problem 1P

Related questions
Question
100%
Data were collected to explain the number of wins a major league baseball team has based on the earned run average (ERA) of the team’s starting pitchers
g) What is the effect on wins of decreasing the ERA by 1 run?
*COMPLETE THE TABLE BELOW*
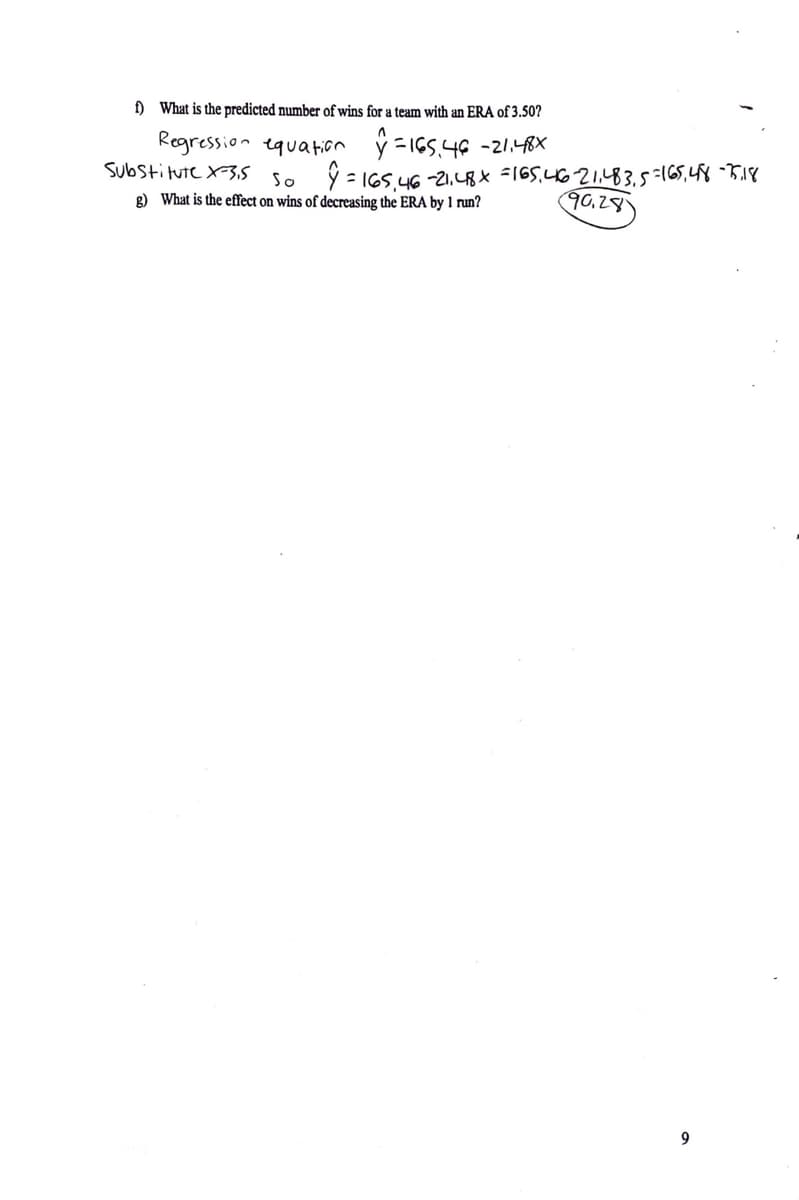
Transcribed Image Text:) What is the predicted number of wins for a team with an ERA of 3.50?
Regression tquation
y =I6S.46 -21.48X
Substitute X35
So ý = 165,46 -21, 48X =165,46 21,483,5=165,48 18
g) What is the effect on wins of decreasing the ERA by 1 run?
90,28
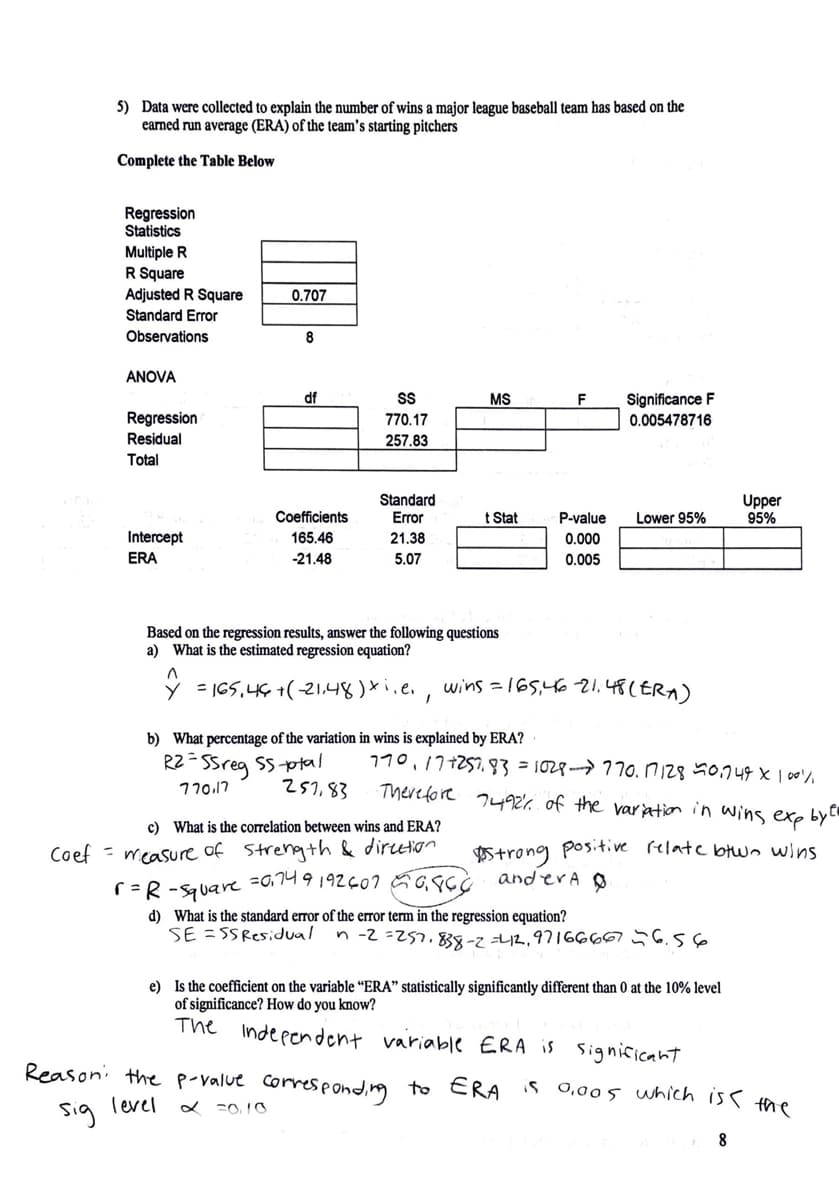
Transcribed Image Text:5) Data were collected to explain the number of wins a major league baseball team has based on the
earned run average (ERA) of the team's starting pitchers
Complete the Table Below
Regression
Statistics
Multiple R
R Square
Adjusted R Square
0.707
Standard Error
Observations
8
ANOVA
Significance F
0.005478716
df
MS
Regression
770.17
Residual
257.83
Total
Standard
Error
Upper
95%
Coefficients
t Stat
P-value
Lower 95%
Intercept
165.46
21.38
0.000
ERA
-21.48
5.07
0.005
Based on the regression results, answer the following questions
a) What is the estimated regression equation?
Y = I65,46 +(-21,48)e,
wins = 165,46 21.48(ERA)
b) What percentage of the variation in wins is explained by ERA?
R2=SSreg SSptal
170,17+257,83 = 1029→770. ni28 50,749 xl 00%
E8 'LSZ
There fore
770.17
7492% of the varation in wins exp byt
c) What is the correlation between wins and ERA?
$5trong pos.tive relate btwn wins
anderA Q
Coef - measure of Strength & diretion
r=R -Square =0:14 9 192607 ñ6,gc
d) What is the standard error of the error term in the regression equation?
SE = SSResidual
n -2 =257.838-242,97166667 56.56
e) Is the coefficient on the variable “ERA" statistically significantly different than 0 at the 10% level
of significance? How do you know?
The Independent variable ERA is Signicicant
Reason: the p-value correspond,ng to ERA
is 0,005 which is < the
Sig Tevel
8.
Expert Solution
This question has been solved!
Explore an expertly crafted, step-by-step solution for a thorough understanding of key concepts.

Step by step
Solved in 2 steps with 2 images

Recommended textbooks for you
MATLAB: An Introduction with Applications
Statistics
ISBN:
9781119256830
Author:
Amos Gilat
Publisher:
John Wiley & Sons Inc

Probability and Statistics for Engineering and th…
Statistics
ISBN:
9781305251809
Author:
Jay L. Devore
Publisher:
Cengage Learning

Statistics for The Behavioral Sciences (MindTap C…
Statistics
ISBN:
9781305504912
Author:
Frederick J Gravetter, Larry B. Wallnau
Publisher:
Cengage Learning
MATLAB: An Introduction with Applications
Statistics
ISBN:
9781119256830
Author:
Amos Gilat
Publisher:
John Wiley & Sons Inc
Probability and Statistics for Engineering and th…
Statistics
ISBN:
9781305251809
Author:
Jay L. Devore
Publisher:
Cengage Learning
Statistics for The Behavioral Sciences (MindTap C…
Statistics
ISBN:
9781305504912
Author:
Frederick J Gravetter, Larry B. Wallnau
Publisher:
Cengage Learning

Elementary Statistics: Picturing the World (7th E…
Statistics
ISBN:
9780134683416
Author:
Ron Larson, Betsy Farber
Publisher:
PEARSON

The Basic Practice of Statistics
Statistics
ISBN:
9781319042578
Author:
David S. Moore, William I. Notz, Michael A. Fligner
Publisher:
W. H. Freeman

Introduction to the Practice of Statistics
Statistics
ISBN:
9781319013387
Author:
David S. Moore, George P. McCabe, Bruce A. Craig
Publisher:
W. H. Freeman