data. out in Calculate: I) II) III) 4. 8 10 15 5 11 9. 12 18 20 17 19 23 28 24 Linear correlation coefficient, and linear strength of the relationship. The equation of regression. When you know the X-50.6 find y. の
data. out in Calculate: I) II) III) 4. 8 10 15 5 11 9. 12 18 20 17 19 23 28 24 Linear correlation coefficient, and linear strength of the relationship. The equation of regression. When you know the X-50.6 find y. の

Glencoe Algebra 1, Student Edition, 9780079039897, 0079039898, 2018
18th Edition
ISBN:9780079039897
Author:Carter
Publisher:Carter
Chapter10: Statistics
Section10.1: Measures Of Center
Problem 9PPS

Related questions
Question
don't copy paste last answers they are wrong I'll downvote
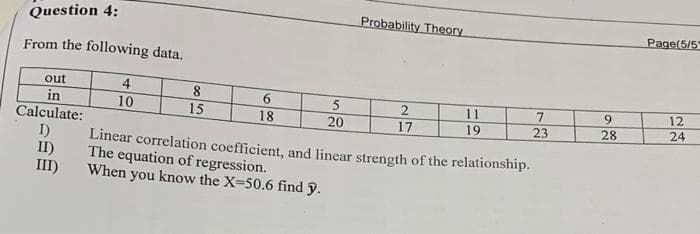
Transcribed Image Text:Question 4:
Probability Theory
Page(5/5
From the following data.
out
4
8
6.
in
Calculate:
I)
II)
III)
10
11
12
9.
15
18
20
17
19
23
28
24
Linear correlation coefficient, and linear strength of the relationship.
The equation of regression.
When you know the X-50.6 find y.
Expert Solution
This question has been solved!
Explore an expertly crafted, step-by-step solution for a thorough understanding of key concepts.

Step by step
Solved in 3 steps with 3 images

Recommended textbooks for you
Glencoe Algebra 1, Student Edition, 9780079039897…
Algebra
ISBN:
9780079039897
Author:
Carter
Publisher:
McGraw Hill

College Algebra
Algebra
ISBN:
9781305115545
Author:
James Stewart, Lothar Redlin, Saleem Watson
Publisher:
Cengage Learning
Glencoe Algebra 1, Student Edition, 9780079039897…
Algebra
ISBN:
9780079039897
Author:
Carter
Publisher:
McGraw Hill
College Algebra
Algebra
ISBN:
9781305115545
Author:
James Stewart, Lothar Redlin, Saleem Watson
Publisher:
Cengage Learning