DATAfile: Sales A sales manager collected the following data on x = years of experience and y = annual sales ($1,000s). The estimated regression equation for these data is ý = 80 Years of Annual Sales Salesperson Experience ($1,000s) 1 80 2 3 97 3 4 92 4 4 102 103 6 111 7 10 119 8 10 123 9 11 117 10 13 136 (a) Compute SST, SSR, and SSE. SST = 2502 X SSR = 2272 SSE = 230 X (b) Compute the coefficient of determination r. (Round your answer to three decimal places.) ,2= 908 x Comment on the goodness of fit. (For purposes of this exercise, consider a proportion large if it is at least 0.55.) The least squares line provided a good fit as a large proportion of the variability in y has been explained by the least squares line. The least squares line did not provide a good fit as a small proportion of the variability in y has been explained by the least squares line. The least squares line provided a good fit as a small proportion of the variability in y has been explained by the least squares line. The least squares line did not provide a good fit as a large proportion of the variability in y has been explained by the least squares line. (c) What is the value of the sample correlation coefficient? (Round your answer to three decimal places.) .953X
DATAfile: Sales A sales manager collected the following data on x = years of experience and y = annual sales ($1,000s). The estimated regression equation for these data is ý = 80 Years of Annual Sales Salesperson Experience ($1,000s) 1 80 2 3 97 3 4 92 4 4 102 103 6 111 7 10 119 8 10 123 9 11 117 10 13 136 (a) Compute SST, SSR, and SSE. SST = 2502 X SSR = 2272 SSE = 230 X (b) Compute the coefficient of determination r. (Round your answer to three decimal places.) ,2= 908 x Comment on the goodness of fit. (For purposes of this exercise, consider a proportion large if it is at least 0.55.) The least squares line provided a good fit as a large proportion of the variability in y has been explained by the least squares line. The least squares line did not provide a good fit as a small proportion of the variability in y has been explained by the least squares line. The least squares line provided a good fit as a small proportion of the variability in y has been explained by the least squares line. The least squares line did not provide a good fit as a large proportion of the variability in y has been explained by the least squares line. (c) What is the value of the sample correlation coefficient? (Round your answer to three decimal places.) .953X

Functions and Change: A Modeling Approach to College Algebra (MindTap Course List)
6th Edition
ISBN:9781337111348
Author:Bruce Crauder, Benny Evans, Alan Noell
Publisher:Bruce Crauder, Benny Evans, Alan Noell
Chapter3: Straight Lines And Linear Functions
Section3.CR: Chapter Review Exercises
Problem 15CR: Life Expectancy The following table shows the average life expectancy, in years, of a child born in...

Related questions
Question
q3
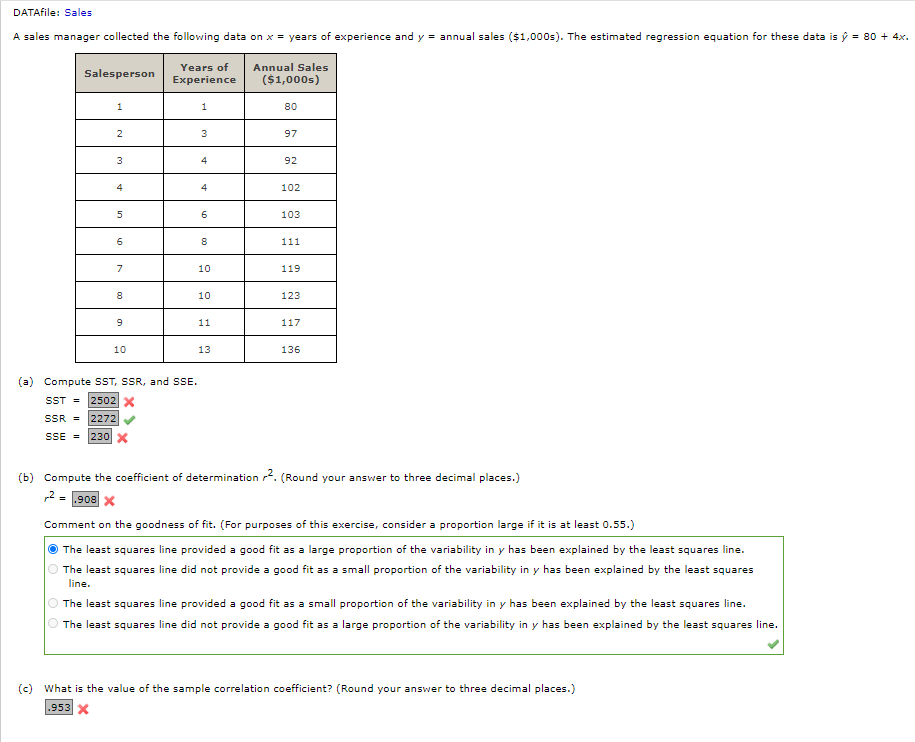
Transcribed Image Text:DATAfile: Sales
A sales manager collected the following data on x = years of experience and y = annual sales ($1,000s). The estimated regression equation for these data is ŷ = 80 + 4x.
Years of
Annual Sales
Salesperson
Experience
($1,000s)
1
80
2
3
97
3
4
92
4
4
102
103
6
111
7
10
119
8
10
123
9
11
117
10
13
136
(a) Compute SST, SSR, and SSE.
SST =
2502 X
SSR = 2272
SSE = 230 X
(b) Compute the coefficient of determination r. (Round your answer to three decimal places.)
,2= 908 x
Comment on the goodness of fit. (For purposes of this exercise, consider a proportion large if it is at least 0.55.)
The least squares line provided a good fit as a large proportion of the variability in y has been explained by the least squares line.
The least squares line did not provide a good fit as a small proportion of the variability in y has been explained by the least squares
line.
The least squares line provided a good fit as a small proportion of the variability in y has been explained by the least squares line.
The least squares line did not provide a good fit as a large proportion of the variability in y has been explained by the least squares line.
(c) What is the value of the sample correlation coefficient? (Round your answer to three decimal places.)
.953X
Expert Solution
This question has been solved!
Explore an expertly crafted, step-by-step solution for a thorough understanding of key concepts.

This is a popular solution!

Trending now
This is a popular solution!

Step by step
Solved in 2 steps with 2 images

Knowledge Booster


Learn more about
Need a deep-dive on the concept behind this application? Look no further. Learn more about this topic, statistics and related others by exploring similar questions and additional content below.Recommended textbooks for you
Functions and Change: A Modeling Approach to Coll…
Algebra
ISBN:
9781337111348
Author:
Bruce Crauder, Benny Evans, Alan Noell
Publisher:
Cengage Learning

Elementary Linear Algebra (MindTap Course List)
Algebra
ISBN:
9781305658004
Author:
Ron Larson
Publisher:
Cengage Learning

Algebra & Trigonometry with Analytic Geometry
Algebra
ISBN:
9781133382119
Author:
Swokowski
Publisher:
Cengage
Functions and Change: A Modeling Approach to Coll…
Algebra
ISBN:
9781337111348
Author:
Bruce Crauder, Benny Evans, Alan Noell
Publisher:
Cengage Learning
Elementary Linear Algebra (MindTap Course List)
Algebra
ISBN:
9781305658004
Author:
Ron Larson
Publisher:
Cengage Learning
Algebra & Trigonometry with Analytic Geometry
Algebra
ISBN:
9781133382119
Author:
Swokowski
Publisher:
Cengage


Glencoe Algebra 1, Student Edition, 9780079039897…
Algebra
ISBN:
9780079039897
Author:
Carter
Publisher:
McGraw Hill