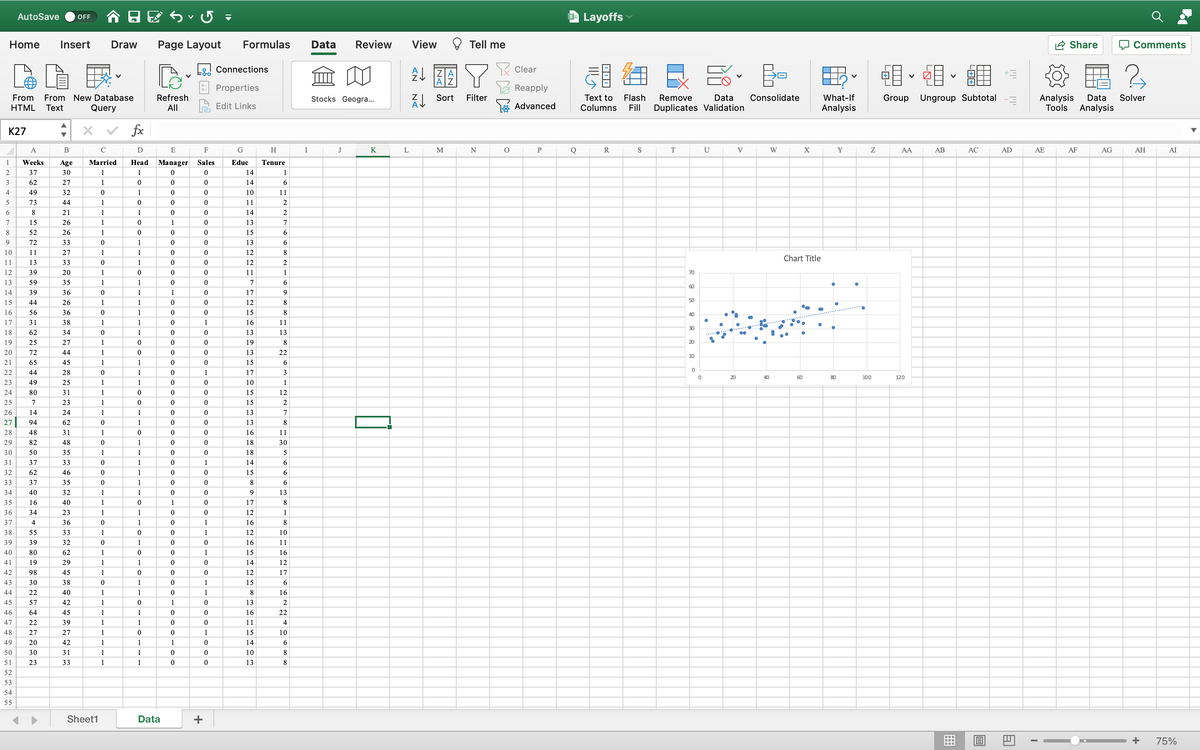
Run two regressions in Excel using the provided Excel file “Layoffs”. The Excel file Layoffs provides data on 50 manufacturing workers who lost their jobs due to layoffs. The data includes the following list of variables: Weeks – the number of weeks a manufacturing worker has been without a job Age – the age of the worker Education – the number of years of education of the worker Married – a dummy variable, equal to 1 if the worker is married, 0 otherwise Head – a dummy variable, equal to 1 if the worker is a head of household, 0 otherwise Tenure – the number of years on the previous job Manager – a dummy variable, equal to 1 if the worker had a management occupation, 0 otherwise Sales – a dummy variable, equal to 1 if the worker had an occupation in sales, 0 otherwise 1. Run a simple regression with a dependent variable Weeks and an independent variable Age. Create the regular and standardized residual plots for the simple regression. 2. Run a multiple regression with a dependent variable Weeks and the following set of independent variables Age, Married, Head, Manager, Sales. Create the regular and standardized residual plots for the multiple regression.
MATLAB: An Introduction with Applications
6th Edition
ISBN:9781119256830
Author:Amos Gilat
Publisher:Amos Gilat
Chapter1: Starting With Matlab
Section: Chapter Questions
Problem 1P
icon
Related questions
icon
Concept explainers
Question

Part I. Run two regressions in Excel using the provided Excel file “Layoffs”.
The Excel file Layoffs provides data on 50 manufacturing workers who lost their jobs due to layoffs. The

data includes the following list of variables:
Weeks – the number of weeks a manufacturing worker has been without a job
Age – the age of the worker
Education – the number of years of education of the worker
Married – a dummy variable, equal to 1 if the worker is married, 0 otherwise
Head – a dummy variable, equal to 1 if the worker is a head of household, 0 otherwise
Tenure – the number of years on the previous job
Manager – a dummy variable, equal to 1 if the worker had a management occupation, 0 otherwise Sales – a dummy variable, equal to 1 if the worker had an occupation in sales, 0 otherwise

1. Run a simple regression with a dependent variable Weeks and an independent variable Age. Create the regular and standardized residual plots for the simple regression.

2. Run a multiple regression with a dependent variable Weeks and the following set of independent variables Age, Married, Head, Manager, Sales. Create the regular and standardized residual plots for the multiple regression.

AutoSave
a Layoffs
OFF
Home
Insert
Draw
Page Layout
Formulas
Data
Review
View
Tell me
Share
O Comments
B-
朝。
L8 Connections
Clear
Properties
Reapply
From New Database
Refresh
All
Sort
Filter
Flash
Fill
What-If
Group
Ungroup Subtotal
Analysis
Tools
From
Stocks Geogra...
Text to
Remove
Data
Consolidate
Data
Solver
HTML
Тext
Query
Edit Links
Advanced
Columns
Duplicates Validation
Analysis
Analysis
K27
fx
A
В
E
F
G
H
I
J
K
L
M
N
P
R
S
T
U
V
W
X
Y
AA
AB
AC
AD
AE
AF
AG
AH
AI
1
Weeks
Age
Married
Head
Manager
Sales
Educ
Tenure
37
30
1
1
14
1
3
62
27
1
14
6.
4
49
32
1
10
11
73
44
1
11
2
6.
8
21
1
1
14
2
7
15
26
1
13
7
8
52
26
1
15
9
72
33
1
13
6
10
11
27
1
1
12
8
Chart Title
11
13
33
1
12
2
12
39
20
1
11
1
70
13
59
35
1
1
7
60
14
39
36
1
1
17
9
50
15
44
26
1
1
12
8
16
56
36
1
15
8
40
17
31
38
1
1
1
16
11
30
18
62
34
1
13
13
19
25
27
1
19
8
20
20
72
44
1
13
22
10
21
65
45
1
1
15
22
44
28
1
1
17
3
20
40
60
80
100
120
23
49
25
1
1
10
1
24
80
31
1
15
12
25
7
23
1
15
26
14
24
1
1
13
7
27
94
62
1
13
8
28
48
31
16
11
29
82
48
1
18
30
30
50
35
1
1
18
5
31
37
33
1
1
14
6
32
62
46
1
15
6
33
37
35
1
8
6
34
40
32
1
1
9
13
35
16
40
1
1
17
36
34
23
1
1
12
1
37
4
36
1
1
16
8
38
55
33
1
1
12
10
39
39
32
1
16
11
40
80
62
1
1
15
16
41
19
29
1
1
14
12
42
98
45
1
12
17
43
30
38
1
1
15
44
22
40
1
1
1
8
16
45
57
42
1
1
13
2
46
64
45
1
1
16
22
47
22
39
1
1
11
4
48
27
27
1
1
15
10
49
20
42
1
1
1
14
50
30
31
1
1
10
8
51
23
33
1
1
13
8
52
53
54
55
Sheet1
Data
+
75%
+
NA
-O o o o o o c o o o o o c
1000
10
Transcribed Image Text:AutoSave a Layoffs OFF Home Insert Draw Page Layout Formulas Data Review View Tell me Share O Comments B- 朝。 L8 Connections Clear Properties Reapply From New Database Refresh All Sort Filter Flash Fill What-If Group Ungroup Subtotal Analysis Tools From Stocks Geogra... Text to Remove Data Consolidate Data Solver HTML Тext Query Edit Links Advanced Columns Duplicates Validation Analysis Analysis K27 fx A В E F G H I J K L M N P R S T U V W X Y AA AB AC AD AE AF AG AH AI 1 Weeks Age Married Head Manager Sales Educ Tenure 37 30 1 1 14 1 3 62 27 1 14 6. 4 49 32 1 10 11 73 44 1 11 2 6. 8 21 1 1 14 2 7 15 26 1 13 7 8 52 26 1 15 9 72 33 1 13 6 10 11 27 1 1 12 8 Chart Title 11 13 33 1 12 2 12 39 20 1 11 1 70 13 59 35 1 1 7 60 14 39 36 1 1 17 9 50 15 44 26 1 1 12 8 16 56 36 1 15 8 40 17 31 38 1 1 1 16 11 30 18 62 34 1 13 13 19 25 27 1 19 8 20 20 72 44 1 13 22 10 21 65 45 1 1 15 22 44 28 1 1 17 3 20 40 60 80 100 120 23 49 25 1 1 10 1 24 80 31 1 15 12 25 7 23 1 15 26 14 24 1 1 13 7 27 94 62 1 13 8 28 48 31 16 11 29 82 48 1 18 30 30 50 35 1 1 18 5 31 37 33 1 1 14 6 32 62 46 1 15 6 33 37 35 1 8 6 34 40 32 1 1 9 13 35 16 40 1 1 17 36 34 23 1 1 12 1 37 4 36 1 1 16 8 38 55 33 1 1 12 10 39 39 32 1 16 11 40 80 62 1 1 15 16 41 19 29 1 1 14 12 42 98 45 1 12 17 43 30 38 1 1 15 44 22 40 1 1 1 8 16 45 57 42 1 1 13 2 46 64 45 1 1 16 22 47 22 39 1 1 11 4 48 27 27 1 1 15 10 49 20 42 1 1 1 14 50 30 31 1 1 10 8 51 23 33 1 1 13 8 52 53 54 55 Sheet1 Data + 75% + NA -O o o o o o c o o o o o c 1000 10
Expert Solution
trending now

Trending now

This is a popular solution!

steps

Step by step

Solved in 4 steps with 12 images

Blurred answer
Knowledge Booster
Correlation, Regression, and Association
Learn more about
Need a deep-dive on the concept behind this application? Look no further. Learn more about this topic, statistics and related others by exploring similar questions and additional content below.
Similar questions
  • SEE MORE QUESTIONS
Recommended textbooks for you
MATLAB: An Introduction with Applications
Statistics
ISBN:
9781119256830
Author:
Amos Gilat
Publisher:
John Wiley & Sons Inc
Probability and Statistics for Engineering and th…
Statistics
ISBN:
9781305251809
Author:
Jay L. Devore
Publisher:
Cengage Learning
Statistics for The Behavioral Sciences (MindTap C…
Statistics
ISBN:
9781305504912
Author:
Frederick J Gravetter, Larry B. Wallnau
Publisher:
Cengage Learning
Elementary Statistics: Picturing the World (7th E…
Statistics
ISBN:
9780134683416
Author:
Ron Larson, Betsy Farber
Publisher:
PEARSON
The Basic Practice of Statistics
Statistics
ISBN:
9781319042578
Author:
David S. Moore, William I. Notz, Michael A. Fligner
Publisher:
W. H. Freeman
Introduction to the Practice of Statistics
Statistics
ISBN:
9781319013387
Author:
David S. Moore, George P. McCabe, Bruce A. Craig
Publisher:
W. H. Freeman