1. An engineer is investigating the effect of process operating temperature on product yield. The study results in the following data: Temperature, "C(x) | 100 | 110 | 120 130 140 | 150 160 | 170 | 180 | 190 Yield, %(y) 51 54 61 | 66 70 74 78 85 89 45 a. Determine the simple linear regression model and plot the graph b. Conduct test of Significance of the coefficient, b to determine if there is linear relationship between the operating temperature and product yield at 1% level of significance. c. Conduct test of significance of the regression model in (a) at 1% significance level and construct the ANOVA Table
1. An engineer is investigating the effect of process operating temperature on product yield. The study results in the following data: Temperature, "C(x) | 100 | 110 | 120 130 140 | 150 160 | 170 | 180 | 190 Yield, %(y) 51 54 61 | 66 70 74 78 85 89 45 a. Determine the simple linear regression model and plot the graph b. Conduct test of Significance of the coefficient, b to determine if there is linear relationship between the operating temperature and product yield at 1% level of significance. c. Conduct test of significance of the regression model in (a) at 1% significance level and construct the ANOVA Table

College Algebra
7th Edition
ISBN:9781305115545
Author:James Stewart, Lothar Redlin, Saleem Watson
Publisher:James Stewart, Lothar Redlin, Saleem Watson
Chapter1: Equations And Graphs
Section: Chapter Questions
Problem 10T: Olympic Pole Vault The graph in Figure 7 indicates that in recent years the winning Olympic men’s...

Related questions
Question
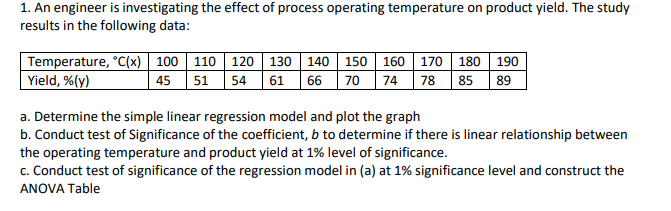
Transcribed Image Text:1. An engineer is investigating the effect of process operating temperature on product yield. The study
results in the following data:
Temperature, °C(x) 100
| Yield, %(y)
130 140 | 150 160 170
61 66 70 74
180 190
85 89
110
120
45 51
78
54
a. Determine the simple linear regression model and plot the graph
b. Conduct test of Significance of the coefficient, b to determine if there is linear relationship between
the operating temperature and product yield at 1% level of significance.
c. Conduct test of significance of the regression model in (a) at 1% significance level and construct the
ANOVA Table
Expert Solution
This question has been solved!
Explore an expertly crafted, step-by-step solution for a thorough understanding of key concepts.

Step by step
Solved in 3 steps with 5 images

Recommended textbooks for you
College Algebra
Algebra
ISBN:
9781305115545
Author:
James Stewart, Lothar Redlin, Saleem Watson
Publisher:
Cengage Learning

Algebra & Trigonometry with Analytic Geometry
Algebra
ISBN:
9781133382119
Author:
Swokowski
Publisher:
Cengage

Functions and Change: A Modeling Approach to Coll…
Algebra
ISBN:
9781337111348
Author:
Bruce Crauder, Benny Evans, Alan Noell
Publisher:
Cengage Learning
College Algebra
Algebra
ISBN:
9781305115545
Author:
James Stewart, Lothar Redlin, Saleem Watson
Publisher:
Cengage Learning
Algebra & Trigonometry with Analytic Geometry
Algebra
ISBN:
9781133382119
Author:
Swokowski
Publisher:
Cengage
Functions and Change: A Modeling Approach to Coll…
Algebra
ISBN:
9781337111348
Author:
Bruce Crauder, Benny Evans, Alan Noell
Publisher:
Cengage Learning

Algebra and Trigonometry (MindTap Course List)
Algebra
ISBN:
9781305071742
Author:
James Stewart, Lothar Redlin, Saleem Watson
Publisher:
Cengage Learning