Consider the following measures based on independently drawn samples from normally distributed populations: (You may find it useful to reference the appropriate table: chi-square table or F table) Sample 1: s = 241, and n1 = 26 Sample 2: s = 220, and n2 = 16 a. Construct the 95% interval estimate for the ratio of the population variances. (Round "P' value and final answers to 2 decimal places.) Confidence interval to b. Using the confidence interval from Part (a), test if the ratio of the population variances differs from 1 at the 5% significance level. The 95% confidence interval the value 1. Thus, we conclude that the population variances differ at the 5% significance level.
Consider the following measures based on independently drawn samples from normally distributed populations: (You may find it useful to reference the appropriate table: chi-square table or F table) Sample 1: s = 241, and n1 = 26 Sample 2: s = 220, and n2 = 16 a. Construct the 95% interval estimate for the ratio of the population variances. (Round "P' value and final answers to 2 decimal places.) Confidence interval to b. Using the confidence interval from Part (a), test if the ratio of the population variances differs from 1 at the 5% significance level. The 95% confidence interval the value 1. Thus, we conclude that the population variances differ at the 5% significance level.

MATLAB: An Introduction with Applications
6th Edition
ISBN:9781119256830
Author:Amos Gilat
Publisher:Amos Gilat
Chapter1: Starting With Matlab
Section: Chapter Questions
Problem 1P

Related questions
Question
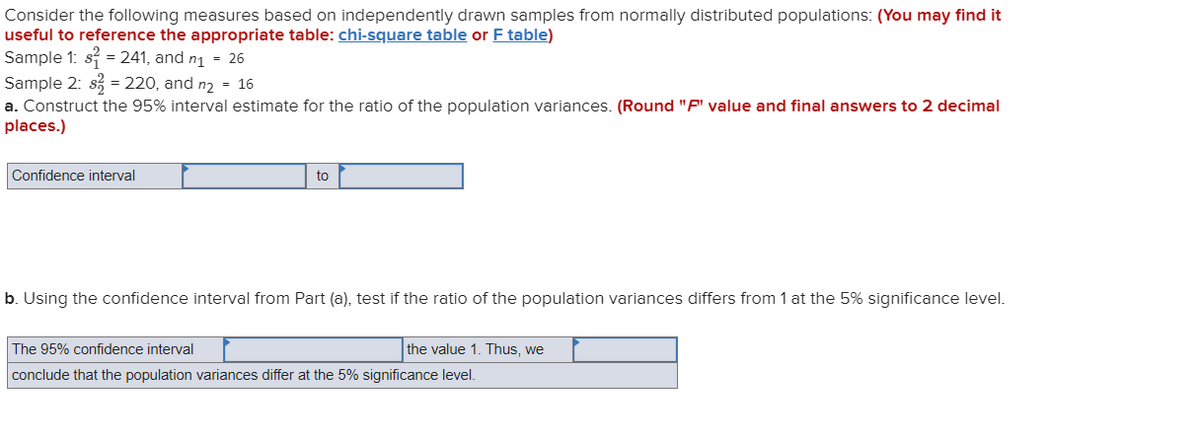
Transcribed Image Text:Consider the following measures based on independently drawn samples from normally distributed populations: (You may find it
useful to reference the appropriate table: chi-square table or F table)
Sample 1: s = 241, and n1 = 26
Sample 2: s = 220, and n2 = 16
a. Construct the 95% interval estimate for the ratio of the population variances. (Round "F" value and final answers to 2 decimal
places.)
Confidence interval
to
b. Using the confidence interval from Part (a), test if the ratio of the population variances differs from 1 at the 5% significance level.
The 95% confidence interval
the value 1. Thus, we
conclude that the population variances differ at the 5% significance level.
Expert Solution
This question has been solved!
Explore an expertly crafted, step-by-step solution for a thorough understanding of key concepts.

This is a popular solution!

Trending now
This is a popular solution!

Step by step
Solved in 3 steps with 2 images

Recommended textbooks for you
MATLAB: An Introduction with Applications
Statistics
ISBN:
9781119256830
Author:
Amos Gilat
Publisher:
John Wiley & Sons Inc

Probability and Statistics for Engineering and th…
Statistics
ISBN:
9781305251809
Author:
Jay L. Devore
Publisher:
Cengage Learning

Statistics for The Behavioral Sciences (MindTap C…
Statistics
ISBN:
9781305504912
Author:
Frederick J Gravetter, Larry B. Wallnau
Publisher:
Cengage Learning
MATLAB: An Introduction with Applications
Statistics
ISBN:
9781119256830
Author:
Amos Gilat
Publisher:
John Wiley & Sons Inc
Probability and Statistics for Engineering and th…
Statistics
ISBN:
9781305251809
Author:
Jay L. Devore
Publisher:
Cengage Learning
Statistics for The Behavioral Sciences (MindTap C…
Statistics
ISBN:
9781305504912
Author:
Frederick J Gravetter, Larry B. Wallnau
Publisher:
Cengage Learning

Elementary Statistics: Picturing the World (7th E…
Statistics
ISBN:
9780134683416
Author:
Ron Larson, Betsy Farber
Publisher:
PEARSON

The Basic Practice of Statistics
Statistics
ISBN:
9781319042578
Author:
David S. Moore, William I. Notz, Michael A. Fligner
Publisher:
W. H. Freeman

Introduction to the Practice of Statistics
Statistics
ISBN:
9781319013387
Author:
David S. Moore, George P. McCabe, Bruce A. Craig
Publisher:
W. H. Freeman