dependent variable Y, and regressor X, : Y, = ßa + BIX, + t1. where i- 1.n, and X, = Y, + Z,. Assume that Cor{Z,u,) = 0. (a) Explain why X, is an endogenous regressor. (b) Show that Z, is a relevant instrument for X,.
dependent variable Y, and regressor X, : Y, = ßa + BIX, + t1. where i- 1.n, and X, = Y, + Z,. Assume that Cor{Z,u,) = 0. (a) Explain why X, is an endogenous regressor. (b) Show that Z, is a relevant instrument for X,.

MATLAB: An Introduction with Applications
6th Edition
ISBN:9781119256830
Author:Amos Gilat
Publisher:Amos Gilat
Chapter1: Starting With Matlab
Section: Chapter Questions
Problem 1P

Related questions
Question
5
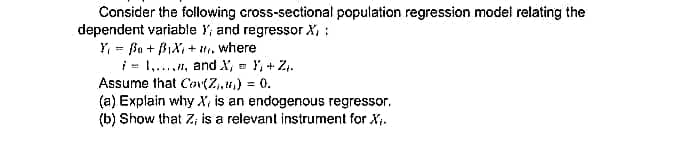
Transcribed Image Text:Consider the following cross-sectional population regression model relating the
dependent variable Y, and regressor X,:
Y, = Ba + BIX, + tti, where
i = 1., and X, = Y, + Z.
Assume that Cov(Z,u,) = 0.
(a) Explain why X, is an endogenous regressor.
(b) Show that Z; is a relevant instrument for X.
Expert Solution
This question has been solved!
Explore an expertly crafted, step-by-step solution for a thorough understanding of key concepts.

Step by step
Solved in 3 steps

Recommended textbooks for you
MATLAB: An Introduction with Applications
Statistics
ISBN:
9781119256830
Author:
Amos Gilat
Publisher:
John Wiley & Sons Inc

Probability and Statistics for Engineering and th…
Statistics
ISBN:
9781305251809
Author:
Jay L. Devore
Publisher:
Cengage Learning

Statistics for The Behavioral Sciences (MindTap C…
Statistics
ISBN:
9781305504912
Author:
Frederick J Gravetter, Larry B. Wallnau
Publisher:
Cengage Learning
MATLAB: An Introduction with Applications
Statistics
ISBN:
9781119256830
Author:
Amos Gilat
Publisher:
John Wiley & Sons Inc
Probability and Statistics for Engineering and th…
Statistics
ISBN:
9781305251809
Author:
Jay L. Devore
Publisher:
Cengage Learning
Statistics for The Behavioral Sciences (MindTap C…
Statistics
ISBN:
9781305504912
Author:
Frederick J Gravetter, Larry B. Wallnau
Publisher:
Cengage Learning

Elementary Statistics: Picturing the World (7th E…
Statistics
ISBN:
9780134683416
Author:
Ron Larson, Betsy Farber
Publisher:
PEARSON

The Basic Practice of Statistics
Statistics
ISBN:
9781319042578
Author:
David S. Moore, William I. Notz, Michael A. Fligner
Publisher:
W. H. Freeman

Introduction to the Practice of Statistics
Statistics
ISBN:
9781319013387
Author:
David S. Moore, George P. McCabe, Bruce A. Craig
Publisher:
W. H. Freeman