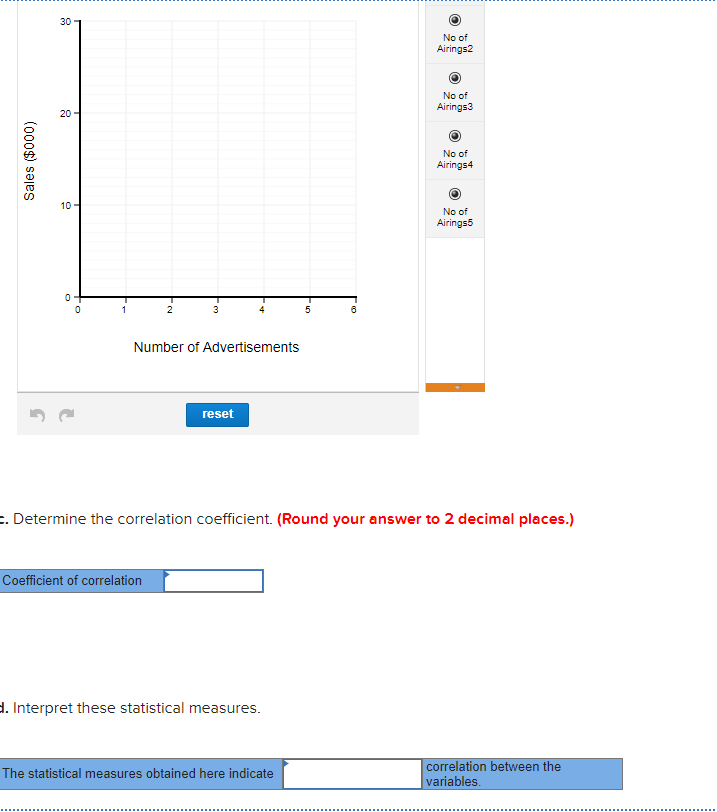
Determine the correlation coefficient. (Round your answer to 2 decimal places.)


Continuous Probability Distributions
Probability distributions are of two types, which are continuous probability distributions and discrete probability distributions. A continuous probability distribution contains an infinite number of values. For example, if time is infinite: you could count from 0 to a trillion seconds, billion seconds, so on indefinitely. A discrete probability distribution consists of only a countable set of possible values.
Normal Distribution
Suppose we had to design a bathroom weighing scale, how would we decide what should be the range of the weighing machine? Would we take the highest recorded human weight in history and use that as the upper limit for our weighing scale? This may not be a great idea as the sensitivity of the scale would get reduced if the range is too large. At the same time, if we keep the upper limit too low, it may not be usable for a large percentage of the population!
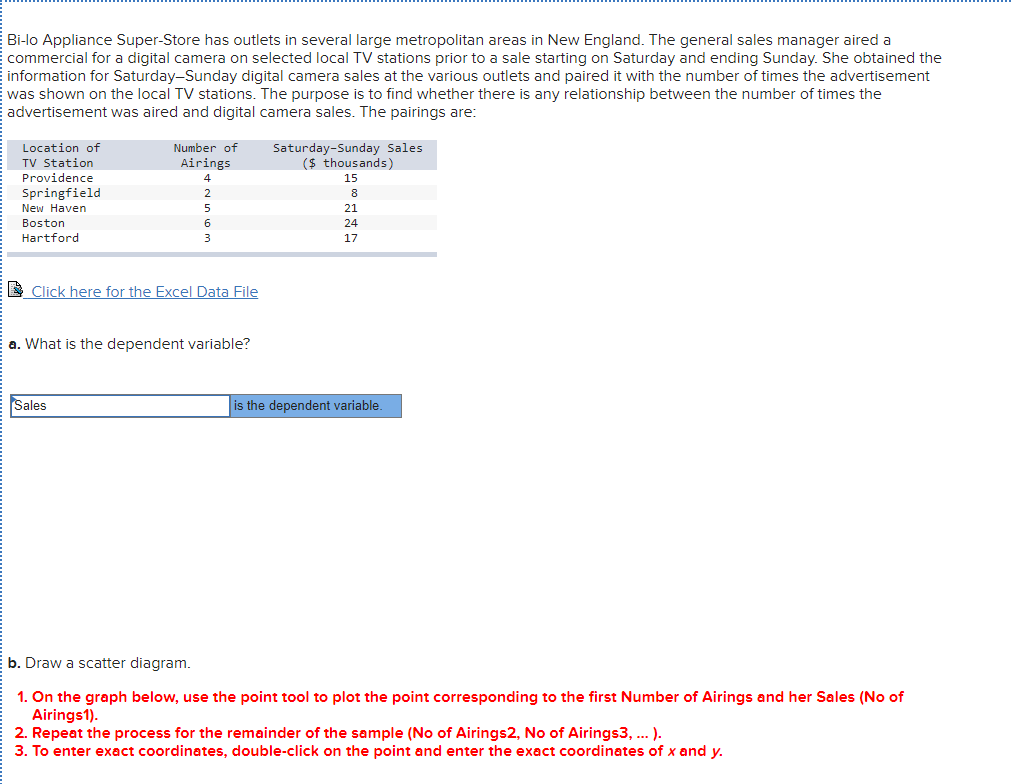
a.
Dependent variable:
The variable that is changed because of the influence of the independent variable is termed as dependent variable.
In this study, the variable ‘Sales’ is changed because of the influence of variable ‘Number of airings’ indicating that ‘Sales’ is dependent variable.
Thus, the dependent variable is Sales.
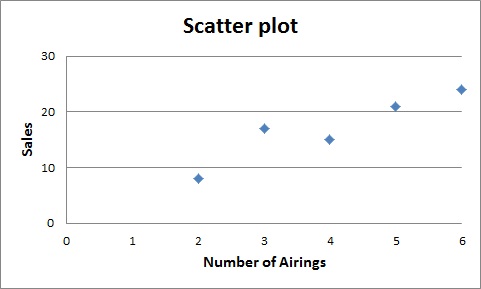
b.
The scatter plot is obtained using EXCEL. The software procedure is given below:
- Enter the data.
- Select Insert > Charts > Scatter > Scatter with only Markers.
The output using EXCEL is as follows:

Step by step
Solved in 2 steps with 2 images


