Determine the following ; Conclusion HYPOTHESIS Calculation

MATLAB: An Introduction with Applications
6th Edition
ISBN:9781119256830
Author:Amos Gilat
Publisher:Amos Gilat
Chapter1: Starting With Matlab
Section: Chapter Questions
Problem 1P

Related questions
Question
Determine the following ;
Conclusion
HYPOTHESIS
Calculation
Transcribed Image Text:ACTIVITY No. 5
SIMPLE COMPARATIVE EXPERIMENTS: T-TEST FOR INDEPENDENT SAMPLES
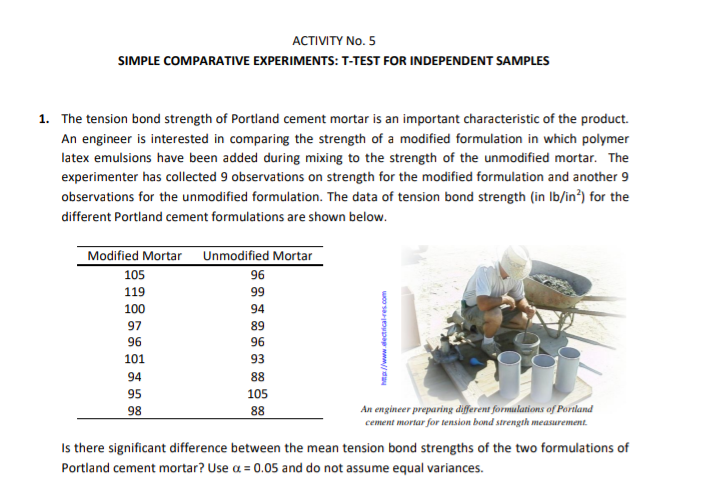
1. The tension bond strength of Portland cement mortar is an important characteristic of the product.
An engineer is interested in comparing the strength of a modified formulation in which polymer
latex emulsions have been added during mixing to the strength of the unmodified mortar. The
experimenter has collected 9 observations on strength for the modified formulation and another 9
observations for the unmodified formulation. The data of tension bond strength (in lb/in²) for the
different Portland cement formulations are shown below.
Modified Mortar Unmodified Mortar
105
96
119
99
100
94
97
89
96
96
101
93
94
88
95
105
98
88
An engineer preparing different formulations of Portland
cement mortar for tension bond strength measurement.
Is there significant difference between the mean tension bond strengths of the two formulations of
Portland cement mortar? Use a = 0.05 and do not assume equal variances.
http://www.dectrical-res.com
Expert Solution
This question has been solved!
Explore an expertly crafted, step-by-step solution for a thorough understanding of key concepts.

Step by step
Solved in 2 steps

Recommended textbooks for you
MATLAB: An Introduction with Applications
Statistics
ISBN:
9781119256830
Author:
Amos Gilat
Publisher:
John Wiley & Sons Inc

Probability and Statistics for Engineering and th…
Statistics
ISBN:
9781305251809
Author:
Jay L. Devore
Publisher:
Cengage Learning

Statistics for The Behavioral Sciences (MindTap C…
Statistics
ISBN:
9781305504912
Author:
Frederick J Gravetter, Larry B. Wallnau
Publisher:
Cengage Learning
MATLAB: An Introduction with Applications
Statistics
ISBN:
9781119256830
Author:
Amos Gilat
Publisher:
John Wiley & Sons Inc
Probability and Statistics for Engineering and th…
Statistics
ISBN:
9781305251809
Author:
Jay L. Devore
Publisher:
Cengage Learning
Statistics for The Behavioral Sciences (MindTap C…
Statistics
ISBN:
9781305504912
Author:
Frederick J Gravetter, Larry B. Wallnau
Publisher:
Cengage Learning

Elementary Statistics: Picturing the World (7th E…
Statistics
ISBN:
9780134683416
Author:
Ron Larson, Betsy Farber
Publisher:
PEARSON

The Basic Practice of Statistics
Statistics
ISBN:
9781319042578
Author:
David S. Moore, William I. Notz, Michael A. Fligner
Publisher:
W. H. Freeman

Introduction to the Practice of Statistics
Statistics
ISBN:
9781319013387
Author:
David S. Moore, George P. McCabe, Bruce A. Craig
Publisher:
W. H. Freeman