Determine the three quartile values for blood cocaine concentration for both ED and Non-ED samples. b. Construct a comparative boxplot (two boxplots on the same set of axes, one above the other), and use it as a basis for comparing and contrasting the ED and non-ED samples. а.
Determine the three quartile values for blood cocaine concentration for both ED and Non-ED samples. b. Construct a comparative boxplot (two boxplots on the same set of axes, one above the other), and use it as a basis for comparing and contrasting the ED and non-ED samples. а.

Linear Algebra: A Modern Introduction
4th Edition
ISBN:9781285463247
Author:David Poole
Publisher:David Poole
Chapter7: Distance And Approximation
Section7.3: Least Squares Approximation
Problem 33EQ

Related questions
Question
Transcribed Image Text:Question 7
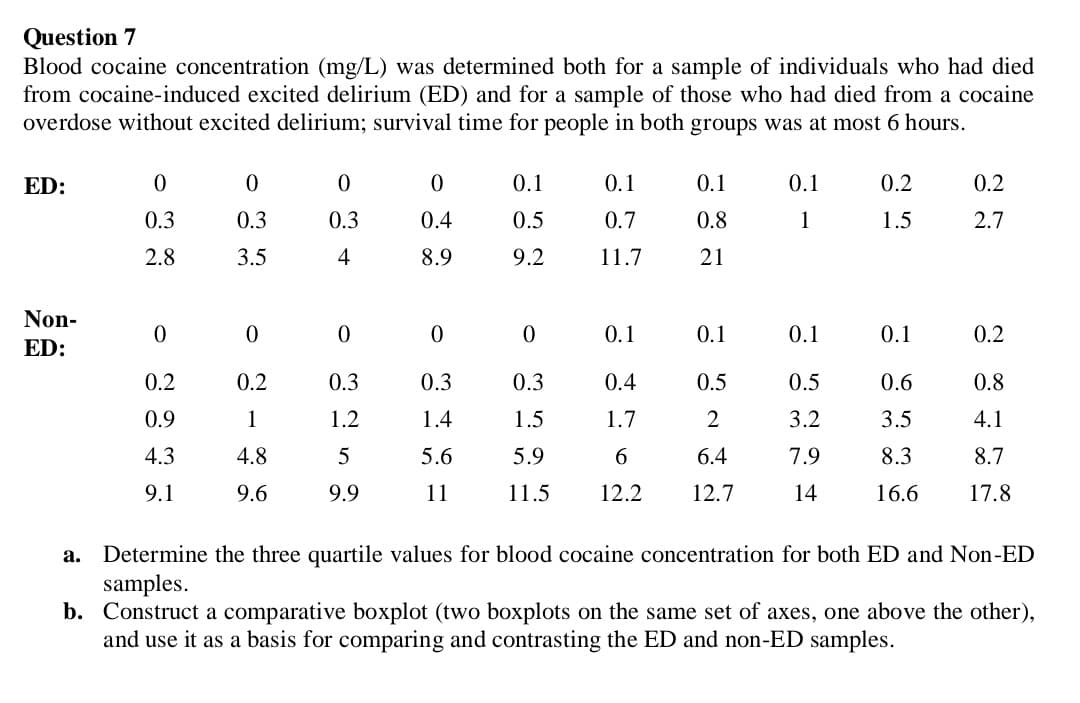
Blood cocaine concentration (mg/L) was determined both for a sample of individuals who had died
from cocaine-induced excited delirium (ED) and for a sample of those who had died from a cocaine
overdose without excited delirium; survival time for people in both groups was at most 6 hours.
ED:
0.1
0.1
0.1
0.1
0.2
0.2
0.3
0.3
0.3
0.4
0.5
0.7
0.8
1
1.5
2.7
2.8
3.5
4
8.9
9.2
11.7
21
Non-
0.1
0.1
0.1
0.1
0.2
ED:
0.2
0.2
0.3
0.3
0.3
0.4
0.5
0.5
0.6
0.8
0.9
1
1.2
1.4
1.5
1.7
2
3.2
3.5
4.1
4.3
4.8
5.6
5.9
6.
6.4
7.9
8.3
8.7
9.1
9.6
9.9
11
11.5
12.2
12.7
14
16.6
17.8
Determine the three quartile values for blood cocaine concentration for both ED and Non-ED
samples.
b. Construct a comparative boxplot (two boxplots on the same set of axes, one above the other),
and use it as a basis for comparing and contrasting the ED and non-ED samples.
а.
Expert Solution
This question has been solved!
Explore an expertly crafted, step-by-step solution for a thorough understanding of key concepts.

Step by step
Solved in 2 steps with 2 images

Recommended textbooks for you
Linear Algebra: A Modern Introduction
Algebra
ISBN:
9781285463247
Author:
David Poole
Publisher:
Cengage Learning

Algebra & Trigonometry with Analytic Geometry
Algebra
ISBN:
9781133382119
Author:
Swokowski
Publisher:
Cengage

Linear Algebra: A Modern Introduction
Algebra
ISBN:
9781285463247
Author:
David Poole
Publisher:
Cengage Learning
Algebra & Trigonometry with Analytic Geometry
Algebra
ISBN:
9781133382119
Author:
Swokowski
Publisher:
Cengage

Glencoe Algebra 1, Student Edition, 9780079039897…
Algebra
ISBN:
9780079039897
Author:
Carter
Publisher:
McGraw Hill

Trigonometry (MindTap Course List)
Trigonometry
ISBN:
9781337278461
Author:
Ron Larson
Publisher:
Cengage Learning
