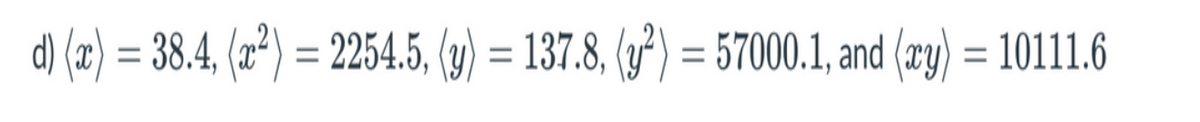
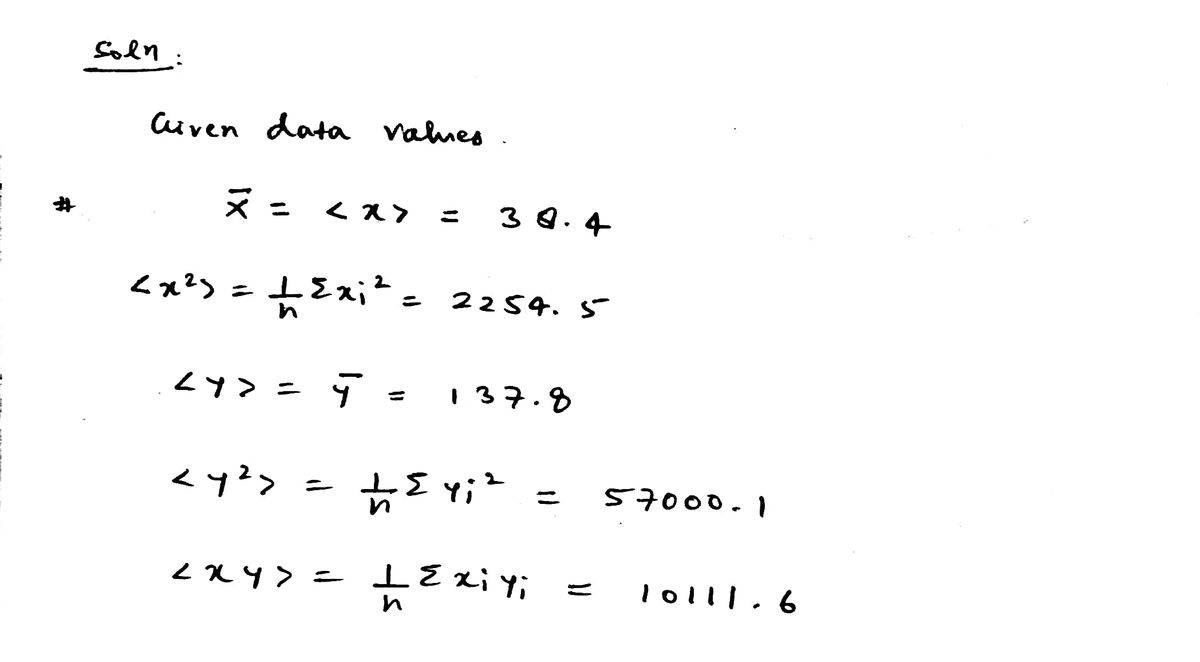
Given the following sets of information, find the linear least squares regression and the correlation coefficient.


Q: Calculate regression equations from the following infcrma- tions: Values of x = 4 6 10 12 Values of ...
A:
Q: In a distribution exactly normal, 7% of the items are under 35 and 89% are under 63. What are the me...
A: The concepts of z-score, normal distribution and standard normal distribution are used to solve the ...
Q: In a large school, it was found that 61% of students are taking a math class, 77% of student are tak...
A:
Q: 300 people of German and French nationalities were interviewed for finding their preference for musi...
A:
Q: ON 2: Computing the Mean and Variance of a Discrete Probability Distribution VIDUAL ACTIVITY #1 umbe...
A: We have given that Probability mass function. I want to find mean and standard deviation Mean = μ...
Q: Q. 3. Calculate regression line of y on x and plot it: Weight of father x: 60 64 70 70 73 75 80 82 W...
A: Data X: 60,64,70,70,73,75,80,82 Y: 70,73,60,73,82,82,75,81
Q: What are Ohio geological statistics
A: The Geographical data of Ohio State are categorized into the following: Field Trips Mining Minerals...
Q: (a) One day, you're feeling a little under the weather. Since you're a responsible human being, you ...
A: Hi! Thank you for the question, As per the honor code, we are allowed to answer three sub-parts at a...
Q: From the following data calculate Spearman's rank correlation coefficient where X and Y are the mark...
A:
Q: ive at least one example for each type of frequency distribution. Cumulative frequency distributio...
A: Number of times a variate value is repeated is called its frequency. CF is the number of observation...
Q: 2. Differentiate quantitative to qualitative research using the Venn diagram. Quantitative Qualitati...
A: Let QlR denote Qualitative Research and QnR denote Quantitative Research. Given
Q: urping (also known as "belching" or "eructation") is one way the human body expels excess gas in you...
A: Since the number of burps for cola and root beer comes from the same participant the data is a paire...
Q: Ques ton 7 Ass umming factory faltoryemployng g00 iworkers s there wl the at least 2 fatal accrden t...
A: Given that n=300 , p=1/1200 , q=1199/1200 X~Binomial(n=300,p=1/1200)
Q: 4. The label on a can of pineapple slices states that the mean carbohydrate content per serving of c...
A:
Q: A sample of 100 gives the mean weekly wage at $. 50 with a standard deviation of $ 10. Another sampl...
A:
Q: Compute the population of 1971 by Binomial expansion method. Years : 1951 1961 1971 1981 1991 Popula...
A: Interpolation is a method which used to measure the missing value. They can be calculated using two ...
Q: The exam has 14 questions, and the total number of marks for the exam is 100. In how many ways can t...
A:
Q: (d) (Advanced) Of selecting two CEOS and finding they both made more than $1 million?
A:
Q: Test Prep. A GRE prep company clainms that average score improvement of their students is equal to 5...
A: We have given that Sample size n =40 Sample mean = 47 Standard deviation = 37
Q: 5. Used Excel to construct a frequency distribution table based on the age of 75 randomly selected p...
A: The following data is given: 37 46 37 26 30 41 28 49 29 34 46 50 38 35 42 35 46 45 27 41 26 45 ...
Q: Q1/For the below frequency distribution table calculate all the below reequipments. Class Frequency ...
A: Frequency of a class is the number of observations lie in that class. Mean of a grouped data using t...
Q: A survey of 8 retirees was taken. Among other things, the retirees were asked to report the age at w...
A:
Q: A ship carries 4 signal flags of different colors. How many different signals hoisting these flags o...
A:
Q: Consider the following scenario to understand the relationship between marginal and average values. ...
A:
Q: Calculate the co-efficient of correlation and the lines of regression for the following data: x = 1 ...
A: Data given X=1,2,3,4,5,6,7,8,9 Y=9,8,10,12,11,13,14,16,15
Q: Describe Sign test for one sample.
A:
Q: A certain four-cylinder combination lock has 45 numbers on it. To open it, you turn to a number on t...
A: Given that a certain four-cylinder combination lock has 45 numbers on it. To open it, you turn to a ...
Q: Suppose we know the following information about a set of bivariate data: (x²) =17.64 (y²) =3.2 (xy) ...
A: Given<x2>=17.64<y2>=3.2<xy>=17.9y=9.3x=-1.2
Q: A random variable x has a density function f(x) = *D, where 0 <x< 2| c(x+1) 2 Find: 1. The value of ...
A: Given function is f(x)=c(x+1)2 , where 0≤x≤2
Q: Quantity Ordered From То Price per Roll 30 $215 31 60 $195 61 120 $175 121 and up $155 k on the data...
A: Quantity Ordered From To Price per Roll 1 30 $215 31 60 $195 61 120 $175 121 and up $155 ...
Q: Suppose that the average number of Facebook friends that users have is normally distributed with a m...
A:
Q: 6. A ski coach claims that she can train beginning skiers for 3 weeks so that at the end of the prog...
A:
Q: f. Find the IQR for the average of 16 coffee drinkers. Q1 ounces Q3: ounces IQR: ounces
A:
Q: 14. (From Open Intro Statistics) The National Survey of Family Growth conducted by the Center for Di...
A: “Since you have posted multiple questions , we will solve first question for you. To get the remaini...
Q: Table 2: Significant Relationship between Management Capability and Productivity of Employees Produc...
A: From the given information, Null Hypothesis: H0: There is no significance relationship between the ...
Q: Find the value of the permutation. 3P1 3P1 =U (Type a whole number.)
A: nPr = n!(n-r)!
Q: 34% of likely U.S. voters think that the federal government should get more involved in fighting loc...
A: Given that; Probability (P) = 34% Sample size (n) = 6 By using binomial distribution Mean = n × ...
Q: Table 3: Significant Influence between Management Capability of Administrators and Productivity of E...
A: The following data is given: Leadership skills Productivity of employees Beta t-value P-v...
Q: he standard normal curve is graphed below. Shade the region under the standard normal curve to the l...
A: We have given that the z-score z = -0.50 Here, we need to shade the region under the standard normal...
Q: Here are the shopping times (in minutes) for a sample of 6 shoppers at a particular grocery store. 2...
A:
Q: -A company has two branches, one on the East Coast and the other on the West Coast. The mean daily s...
A:
Q: A ice-Cream seller has to for more stoIce for the Banie 'Holiday weekend. He estimal ted that lf the...
A: The conditional probability of happening of event A when event B already happened, can be expressed ...
Q: Histogram of US_county_data$median_age_2017 30 40 50 60 70 20 US county_data$median_age_2017 Relativ...
A: The relative frequency for a given distribution is assumed as the likelihood of occurring (i.e., how...
Q: Test Score=680- 1.60 ×STR- 0.65 ×PctEL (0.60) 8. n = 500 (8) (0.34) Robust standard errors appear in...
A: Given: The obtained coefficient of PctEL (bp) = -0.65 The standard error of PctEL (SEp) = 0.34 Sampl...
Q: trials. The probability of success for each trial is 0.3. What is the probability of obtaining 190-2...
A:
Q: QUESTION 12 Find the correlation coefficient for the following data: Obs. Y 1 6 2 8 6 3 10 4 7 4 O 0...
A: Given data : Sr no X Y 1 2 6 2 8 6 3 9 10 4 7 4
Q: Table 1: Significant difference in the Management Capability of Administrators When Grouped by Gende...
A: From the given information, Null Hypothesis: H0: There is no significance difference in the Manageme...
Q: The number of times per year a person uses rapid transit is a linear function of income: Y= 1.2+2.4X...
A: Let, Y = The number of times per year a person uses rapid transit. X1: Medium income X2: High incom...
Q: Using the frequency distribution, describe the shape in terms of its skewness and kurtosis (calculat...
A: Number of times a variate value is repeated is called its frequency. For the given data to compute S...
Q: You wish to test the following claim (Ha) at a significance level of a = 0.005. H.:µ = 87.7 Ha:µ + 8...
A: Given data is 98.2 , 101.2 , 89.2 , 90.1 , 96.6 , 100.7sample size(n)=6sample mean(x¯)=98.2+101.2+89...
2. d Given the following sets of information, find the linear least squares

Step by step
Solved in 3 steps with 3 images
