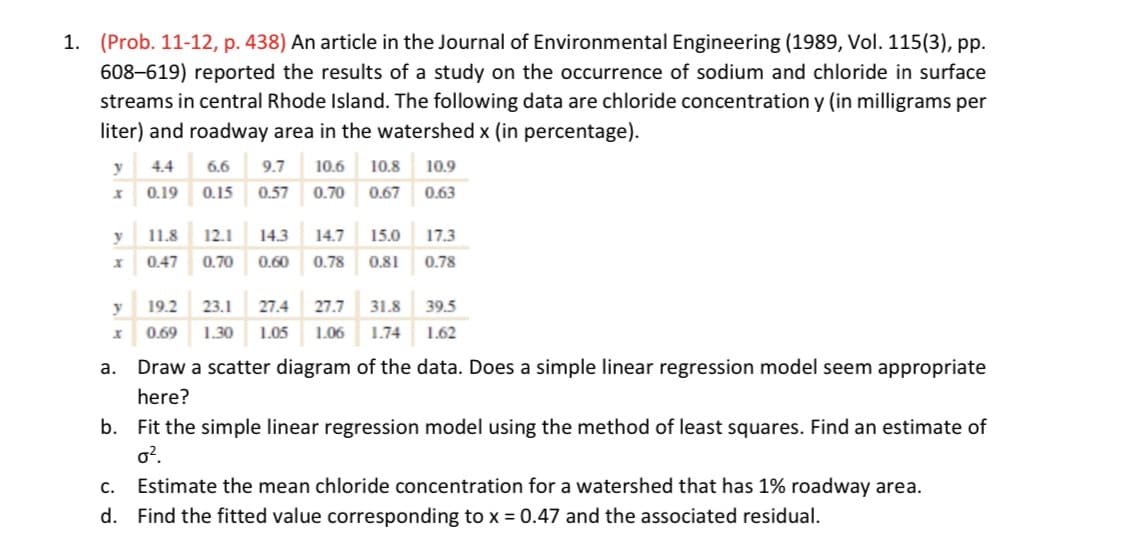
(Prob. 11-12, p. 438) An article in the Journal of Environmental Engineering (1989, Vol. 115(3), pp. 608–619) reported the results of a study on the occurrence of sodium and chloride in surface streams in central Rhode Island. The following data are chloride concentration y (in milligrams per liter) and roadway area in the watershed x (in percentage). 4.4 6.6 9.7 10.6 10.8 10.9 I 0.19 0.15 0.57 0.70 0.67 0.63 y 11.8 12.1 14.3 14.7 15.0 17.3 0.47 0.70 0.60 0.78 0.81 0.78 19.2 23.1 27.4 27.7 31.8 39.5 0.69 1.30 1.05 1.06 1.74 1.62 Draw a scatter diagram of the data. Does a simple linear regression model seem appropriate here? b. Fit the simple linear regression model using the method of least squares. Find an estimate of o?. Estimate the mean chloride concentration for a watershed that has 1% roadway area. d. Find the fitted value corresponding to x = 0.47 and the associated residual. с.
(Prob. 11-12, p. 438) An article in the Journal of Environmental Engineering (1989, Vol. 115(3), pp. 608–619) reported the results of a study on the occurrence of sodium and chloride in surface streams in central Rhode Island. The following data are chloride concentration y (in milligrams per liter) and roadway area in the watershed x (in percentage). 4.4 6.6 9.7 10.6 10.8 10.9 I 0.19 0.15 0.57 0.70 0.67 0.63 y 11.8 12.1 14.3 14.7 15.0 17.3 0.47 0.70 0.60 0.78 0.81 0.78 19.2 23.1 27.4 27.7 31.8 39.5 0.69 1.30 1.05 1.06 1.74 1.62 Draw a scatter diagram of the data. Does a simple linear regression model seem appropriate here? b. Fit the simple linear regression model using the method of least squares. Find an estimate of o?. Estimate the mean chloride concentration for a watershed that has 1% roadway area. d. Find the fitted value corresponding to x = 0.47 and the associated residual. с.

Linear Algebra: A Modern Introduction
4th Edition
ISBN:9781285463247
Author:David Poole
Publisher:David Poole
Chapter7: Distance And Approximation
Section7.3: Least Squares Approximation
Problem 31EQ

Related questions
Question
Transcribed Image Text:1. (Prob. 11-12, p. 438) An article in the Journal of Environmental Engineering (1989, Vol. 115(3), pp.
608–619) reported the results of a study on the occurrence of sodium and chloride in surface
streams in central Rhode Island. The following data are chloride concentration y (in milligrams per
liter) and roadway area in the watershed x (in percentage).
y
4.4
6.6
9.7
10.6
10.8
10.9
0.19
0.15
0.57
0.70
0.67
0.63
y
11.8
12.1
14.3
14.7
15.0
17.3
0.47
0.70
0.60
0.78
0.81
0.78
y
19.2
23.1
27.4
27.7
31.8
39.5
0.69
1.30
1.05
1.06
1.74
1.62
a.
Draw a scatter diagram of the data. Does a simple linear regression model seem appropriate
here?
b. Fit the simple linear regression model using the method of least squares. Find an estimate of
o?.
C.
Estimate the mean chloride concentration for a watershed that has 1% roadway area.
d. Find the fitted value corresponding to x = 0.47 and the associated residual.
Expert Solution
This question has been solved!
Explore an expertly crafted, step-by-step solution for a thorough understanding of key concepts.

This is a popular solution!

Trending now
This is a popular solution!

Step by step
Solved in 2 steps with 2 images

Recommended textbooks for you
Linear Algebra: A Modern Introduction
Algebra
ISBN:
9781285463247
Author:
David Poole
Publisher:
Cengage Learning

Functions and Change: A Modeling Approach to Coll…
Algebra
ISBN:
9781337111348
Author:
Bruce Crauder, Benny Evans, Alan Noell
Publisher:
Cengage Learning
Linear Algebra: A Modern Introduction
Algebra
ISBN:
9781285463247
Author:
David Poole
Publisher:
Cengage Learning
Functions and Change: A Modeling Approach to Coll…
Algebra
ISBN:
9781337111348
Author:
Bruce Crauder, Benny Evans, Alan Noell
Publisher:
Cengage Learning