Determine the validity of the following experiment based on the trend of the results. 3.5 3.0 2.5- 2.0 1.5 1.0 0.5- 0.0 0.0 0.1 0.2 0.3 0.4 0.5 0.6 pulling force (N) O A. Experiment's results lie close to the best fit line and have no noticeable outliers; it is reliable. B. Experiment's results lie close to the best fit line and have no noticeable outliers; it is not reliable. C. Experiment's results vary greatly from the best fit line; this variation means the data is reliable. OD. Experiment's results vary greatly from the best fit line; this variation means the data is not reliable. Reset Selection acceleration (ms")
Determine the validity of the following experiment based on the trend of the results. 3.5 3.0 2.5- 2.0 1.5 1.0 0.5- 0.0 0.0 0.1 0.2 0.3 0.4 0.5 0.6 pulling force (N) O A. Experiment's results lie close to the best fit line and have no noticeable outliers; it is reliable. B. Experiment's results lie close to the best fit line and have no noticeable outliers; it is not reliable. C. Experiment's results vary greatly from the best fit line; this variation means the data is reliable. OD. Experiment's results vary greatly from the best fit line; this variation means the data is not reliable. Reset Selection acceleration (ms")

University Physics Volume 1
18th Edition
ISBN:9781938168277
Author:William Moebs, Samuel J. Ling, Jeff Sanny
Publisher:William Moebs, Samuel J. Ling, Jeff Sanny
Chapter16: Waves
Section: Chapter Questions
Problem 45P: A quality assurance engineer at a frying pan company is asked to qualify a new line of...

Related questions

Concept explainers
Compton effect
The incoming photons' energy must be in the range of an X-ray frequency to generate the Compton effect. The electron does not lose enough energy that reduces the wavelength of scattered photons towards the visible spectrum. As a result, with visible lights, the Compton effect is missing.
Recoil Velocity
The amount of backward thrust or force experienced by a person when he/she shoots a gun in the forward direction is called recoil velocity. This phenomenon always follows the law of conservation of linear momentum.
Question
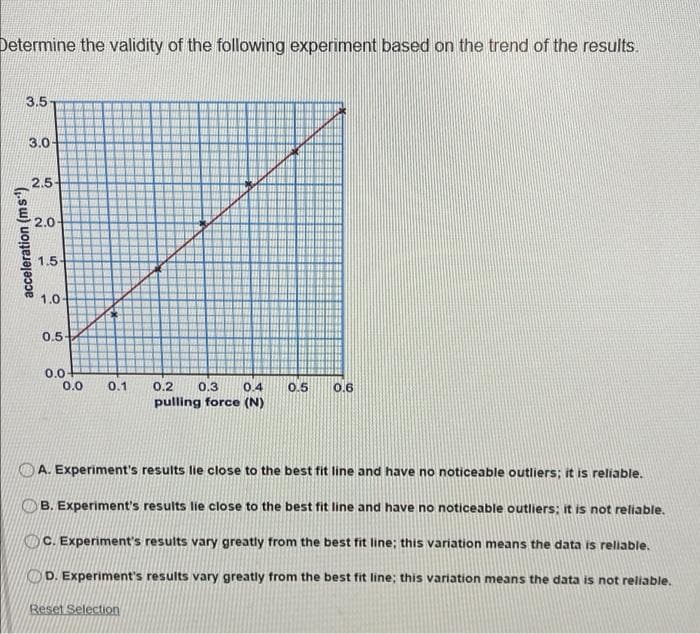
Transcribed Image Text:Determine the validity of the following experiment based on the trend of the results.
3.5
3.0-
2.5-
2.0
1.5
1.0
0.5-
0.0
0.0
0.1
0.2
0.3
0.4
0.5
0.6
pulling force (N)
A. Experiment's results lie close to the best fit line and have no noticeable outliers; it is reliable.
B. Experiment's results lie close to the best fit line and have no noticeable outliers; it is not reliable,
C. Experiment's results vary greatly from the best fit line; this variation means the data is reliable.
OD. Experiment's results vary greatly from the best fit line; this variation means the data is not reliable.
Reset Selection
acceleration (ms')
Expert Solution
This question has been solved!
Explore an expertly crafted, step-by-step solution for a thorough understanding of key concepts.

This is a popular solution!

Trending now
This is a popular solution!

Step by step
Solved in 2 steps with 1 images

Knowledge Booster


Learn more about
Need a deep-dive on the concept behind this application? Look no further. Learn more about this topic, physics and related others by exploring similar questions and additional content below.Recommended textbooks for you
University Physics Volume 1
Physics
ISBN:
9781938168277
Author:
William Moebs, Samuel J. Ling, Jeff Sanny
Publisher:
OpenStax - Rice University

College Physics
Physics
ISBN:
9781938168000
Author:
Paul Peter Urone, Roger Hinrichs
Publisher:
OpenStax College

University Physics Volume 1
Physics
ISBN:
9781938168277
Author:
William Moebs, Samuel J. Ling, Jeff Sanny
Publisher:
OpenStax - Rice University
College Physics
Physics
ISBN:
9781938168000
Author:
Paul Peter Urone, Roger Hinrichs
Publisher:
OpenStax College

University Physics Volume 3
Physics
ISBN:
9781938168185
Author:
William Moebs, Jeff Sanny
Publisher:
OpenStax