Determine whether the following graph can represent a normal curve. Could the graph represent a normal curve? Select all that apply.
Determine whether the following graph can represent a normal curve. Could the graph represent a normal curve? Select all that apply.

Glencoe Algebra 1, Student Edition, 9780079039897, 0079039898, 2018
18th Edition
ISBN:9780079039897
Author:Carter
Publisher:Carter
Chapter10: Statistics
Section10.4: Distributions Of Data
Problem 19PFA

Related questions
Question
100%
20
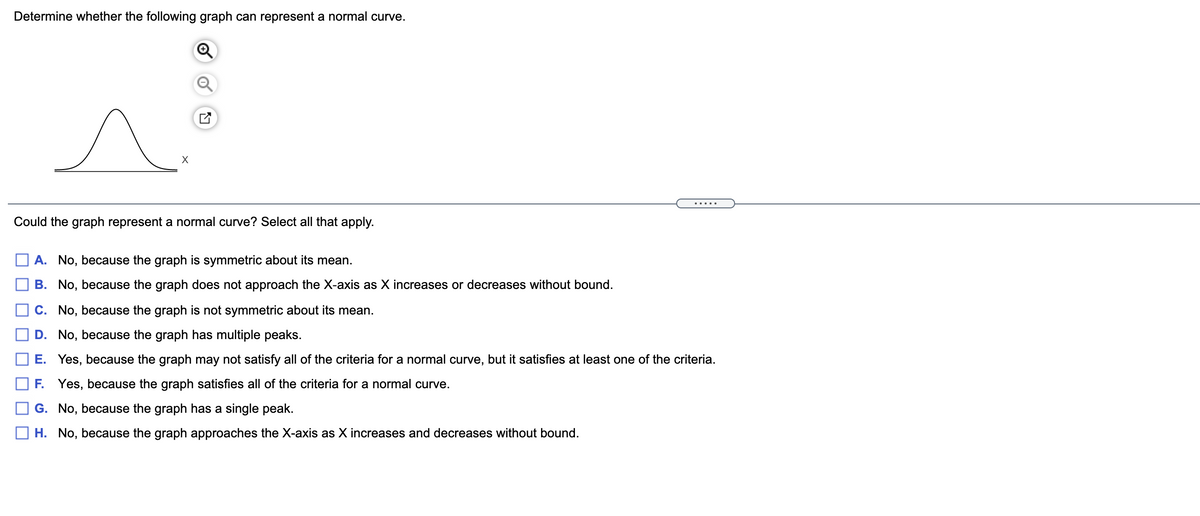
Transcribed Image Text:Determine whether the following graph can represent a normal curve.
.....
Could the graph represent a normal curve? Select all that apply.
A. No, because the graph is symmetric about its mean.
B. No, because the graph does not approach the X-axis as X increases or decreases without bound.
C. No, because the graph is not symmetric about its mean.
D. No, because the graph has multiple peaks.
E. Yes, because the graph may not satisfy all of the criteria for a normal curve, but it satisfies at least one of the criteria.
F. Yes, because the graph satisfies all of the criteria for a normal curve.
G. No, because the graph has a single peak.
H. No, because the graph approaches the X-axis as X increases and decreases without bound.
Expert Solution
This question has been solved!
Explore an expertly crafted, step-by-step solution for a thorough understanding of key concepts.

This is a popular solution!

Trending now
This is a popular solution!

Step by step
Solved in 2 steps

Recommended textbooks for you
Glencoe Algebra 1, Student Edition, 9780079039897…
Algebra
ISBN:
9780079039897
Author:
Carter
Publisher:
McGraw Hill
Glencoe Algebra 1, Student Edition, 9780079039897…
Algebra
ISBN:
9780079039897
Author:
Carter
Publisher:
McGraw Hill