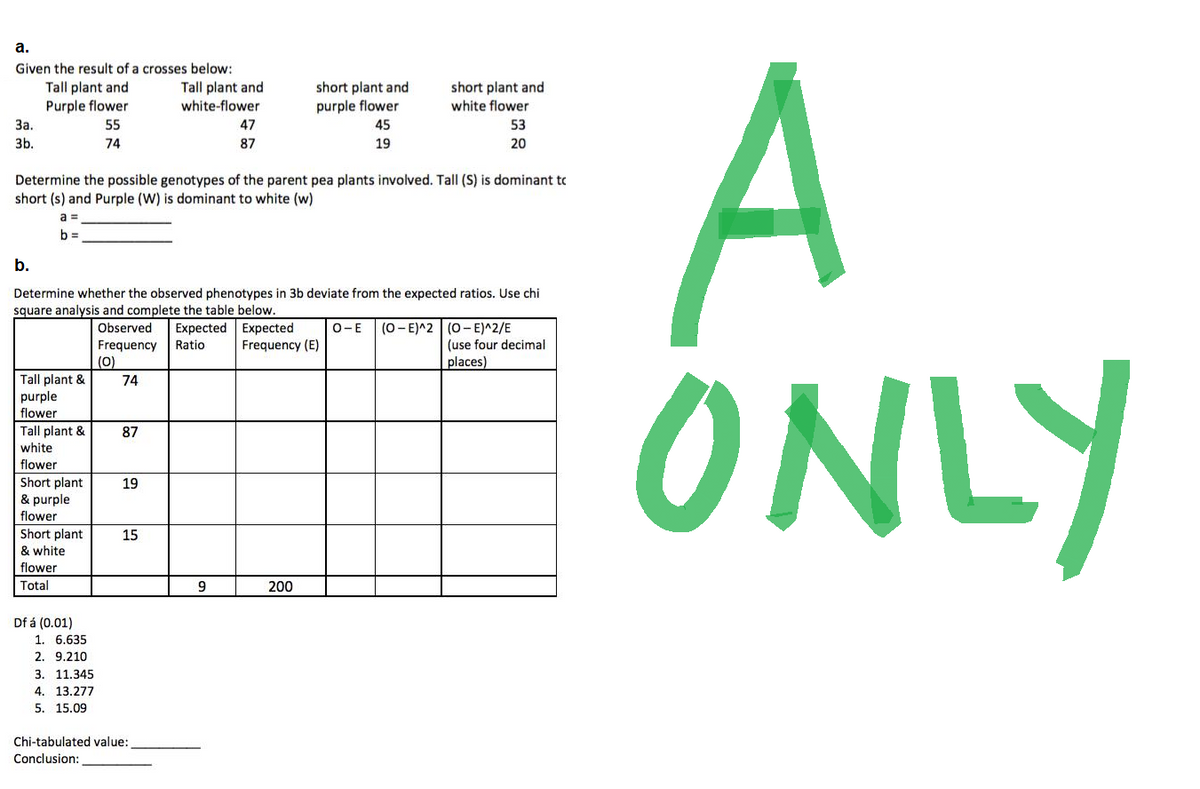
a. Given the result of a crosses below: Tall plant and short plant and Tall plant and Purple flower short plant and white flower white-flower purple flower 3a. 55 47 45 53 3b. 74 87 19 20 Determine the possible genotypes of the parent pea plants involved. Tall (S) is dominant t short (s) and Purple (W) is dominant to white (w) a = b=
a. Given the result of a crosses below: Tall plant and short plant and Tall plant and Purple flower short plant and white flower white-flower purple flower 3a. 55 47 45 53 3b. 74 87 19 20 Determine the possible genotypes of the parent pea plants involved. Tall (S) is dominant t short (s) and Purple (W) is dominant to white (w) a = b=
Human Heredity: Principles and Issues (MindTap Course List)
11th Edition
ISBN:9781305251052
Author:Michael Cummings
Publisher:Michael Cummings
Chapter3: Transmission Of Genes From Generation To Generation
Section: Chapter Questions
Problem 16QP: More Crosses with Pea Plants: The Principle of Independent Assortment Consider the following cross...
Related questions
Question
100%
Can you please answer this completely and typewritten? I promise that I will upvote. Thank you and much appreciated.

Transcribed Image Text:a.
Given the result of a crosses below:
Tall plant and
short plant and
short plant and
Tall plant and
Purple flower
white-flower
purple flower
white flower
3a.
55
47
45
53
3b.
74
87
19
20
Determine the possible genotypes of the parent pea plants involved. Tall (S) is dominant to
short (s) and Purple (W) is dominant to white (w)
a =
b=
b.
Determine whether the observed phenotypes in 3b deviate from the expected ratios. Use chi
square analysis and complete the table below.
O-E (O-E)^2
Observed Expected
Ratio
Expected
Frequency (E)
Frequency
(0-E)^2/E
(use four decimal
places)
(0)
Tall plant &
74
purple
flower
Tall plant &
87
white
flower
Short plant
19
& purple
flower
15
Short plant
& white
flower
Total
200
Df á (0.01)
1. 6.635
2. 9.210
3. 11.345
4. 13.277
5. 15.09
Chi-tabulated value:
Conclusion:
9
A
ONLY
Expert Solution
This question has been solved!
Explore an expertly crafted, step-by-step solution for a thorough understanding of key concepts.
Step by step
Solved in 5 steps

Knowledge Booster
Learn more about
Need a deep-dive on the concept behind this application? Look no further. Learn more about this topic, biology and related others by exploring similar questions and additional content below.Recommended textbooks for you

Human Heredity: Principles and Issues (MindTap Co…
Biology
ISBN:
9781305251052
Author:
Michael Cummings
Publisher:
Cengage Learning

Concepts of Biology
Biology
ISBN:
9781938168116
Author:
Samantha Fowler, Rebecca Roush, James Wise
Publisher:
OpenStax College

Human Heredity: Principles and Issues (MindTap Co…
Biology
ISBN:
9781305251052
Author:
Michael Cummings
Publisher:
Cengage Learning

Concepts of Biology
Biology
ISBN:
9781938168116
Author:
Samantha Fowler, Rebecca Roush, James Wise
Publisher:
OpenStax College