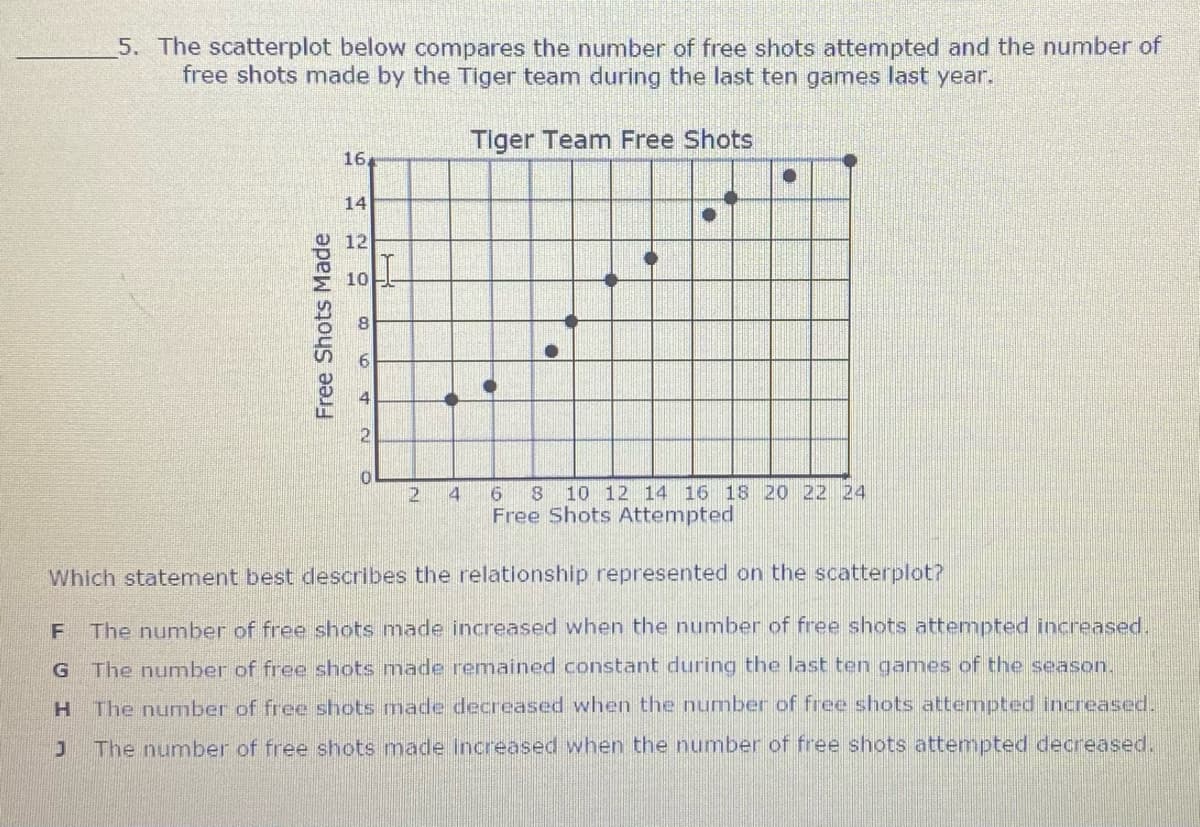
5. The scatterplot below compares the number of free shots attempted and the number of free shots made by the Tiger team during the last ten games last year. Tiger Team Free Shots 16 14 12 10 8. 2. 4 6. 10 12 14 16 18 20 22 24 Free Shots Attempted Which statement best describes the relationship represented on the scatterplot? F The number of free shots made increased when the number of free shots attempted increased. The number of free shots made remained constant during the last ten games of the season. The number of free shots made decreased when the number of free shots attempted increased. The number of free shots made increased when the number of free shots attempted decreased. Free Shots Made


Correlation
Correlation defines a relationship between two independent variables. It tells the degree to which variables move in relation to each other. When two sets of data are related to each other, there is a correlation between them.
Linear Correlation
A correlation is used to determine the relationships between numerical and categorical variables. In other words, it is an indicator of how things are connected to one another. The correlation analysis is the study of how variables are related.
Regression Analysis
Regression analysis is a statistical method in which it estimates the relationship between a dependent variable and one or more independent variable. In simple terms dependent variable is called as outcome variable and independent variable is called as predictors. Regression analysis is one of the methods to find the trends in data. The independent variable used in Regression analysis is named Predictor variable. It offers data of an associated dependent variable regarding a particular outcome.


Trending now
This is a popular solution!

Step by step
Solved in 2 steps with 2 images


