Determine which of the four levels of measurement (nominal, ordinal, interval, ratio) is most appropriate. Types of movies (drama, comedy, adventure, documentary, etc.) Choose the correct answer below. O A. The interval level of measurement is most appropriate because differences are meaningful, but there is no natural zero. B. The nominal level of measurement is most appropriate because data cannot be arranged in an ordering scheme. O C. The ordinal level of measurement is most appropriate because categories are ordered, but differences cannot be found c O D. The ratio level of measurement is most appropriate because ratios are meaningful, and there is also a natural zero.
Determine which of the four levels of measurement (nominal, ordinal, interval, ratio) is most appropriate. Types of movies (drama, comedy, adventure, documentary, etc.) Choose the correct answer below. O A. The interval level of measurement is most appropriate because differences are meaningful, but there is no natural zero. B. The nominal level of measurement is most appropriate because data cannot be arranged in an ordering scheme. O C. The ordinal level of measurement is most appropriate because categories are ordered, but differences cannot be found c O D. The ratio level of measurement is most appropriate because ratios are meaningful, and there is also a natural zero.

Glencoe Algebra 1, Student Edition, 9780079039897, 0079039898, 2018
18th Edition
ISBN:9780079039897
Author:Carter
Publisher:Carter
Chapter10: Statistics
Section10.5: Comparing Sets Of Data
Problem 26PFA

Related questions
Question
100%
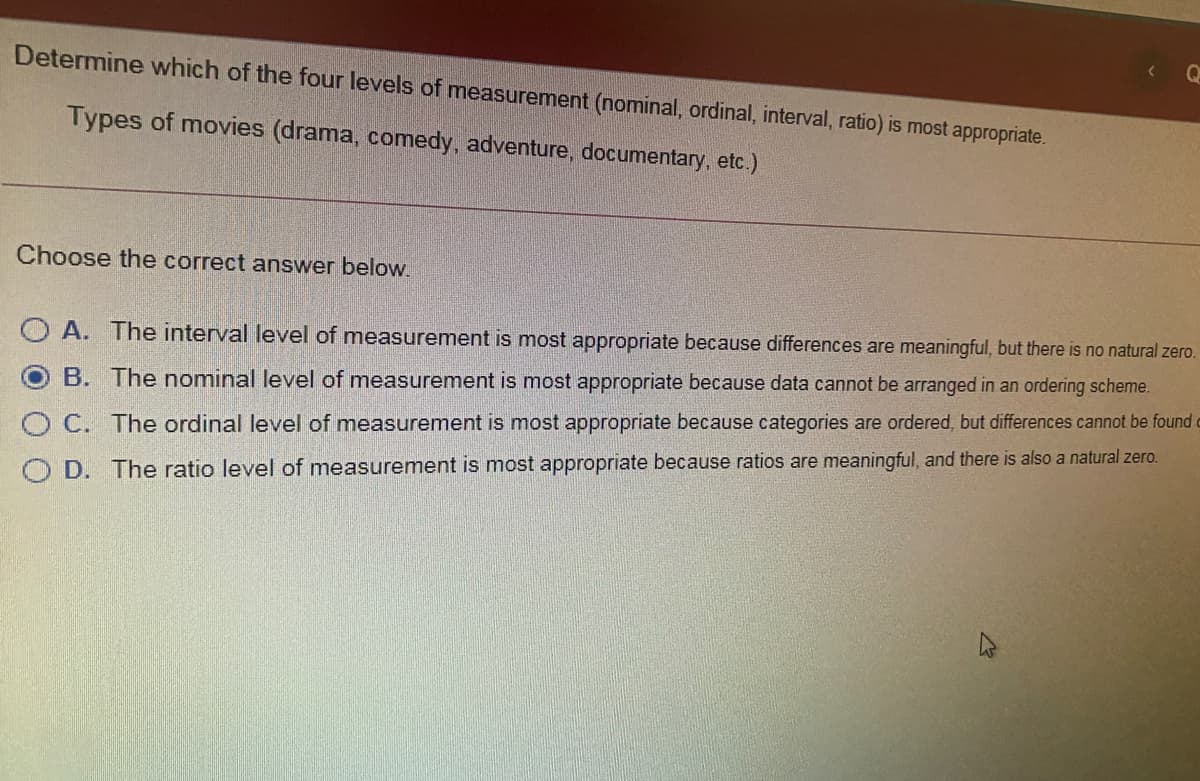
Transcribed Image Text:Determine which of the four levels of measurement (nominal, ordinal, interval, ratio) is most appropriate.
Types of movies (drama, comedy, adventure, documentary, etc.)
Choose the correct answer below.
O A. The interval level of measurement is most appropriate because differences are meaningful, but there is no natural zero.
B. The nominal level of measurement is most appropriate because data cannot be arranged in an ordering scheme.
O C. The ordinal level of measurement is most appropriate because categories are ordered, but differences cannot be found o
O D. The ratio level of measurement is most appropriate because ratios are meaningful, and there is also a natural zero.
Transcribed Image Text:point(s) posSIDIe
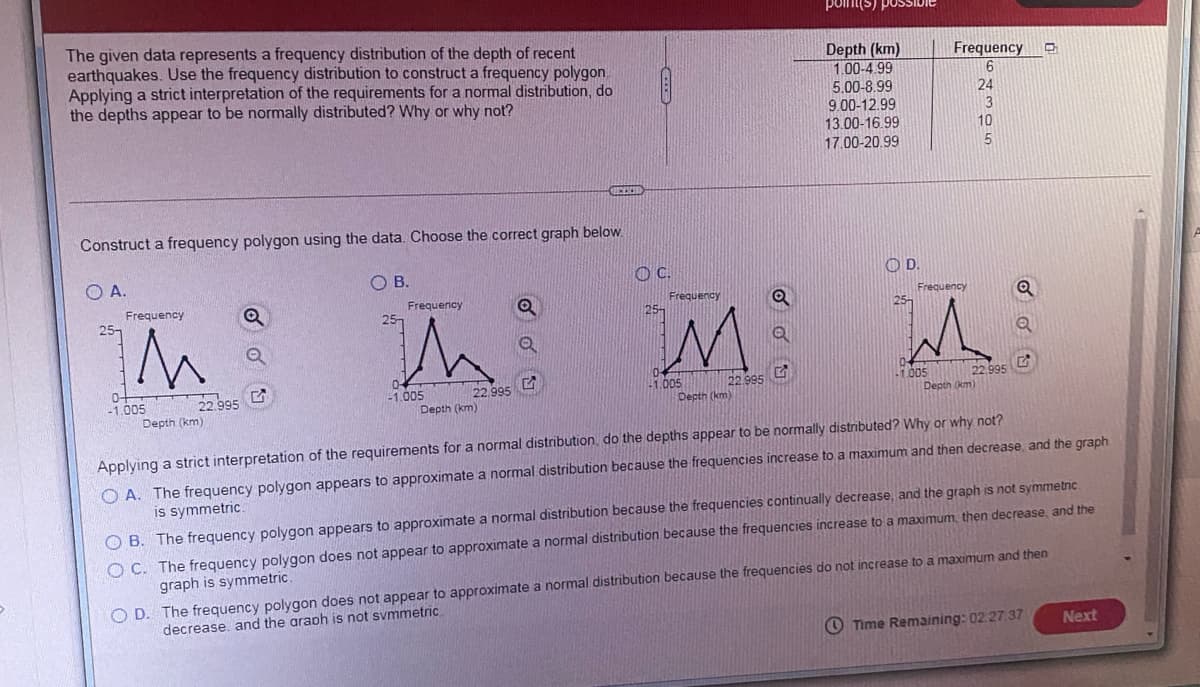
The given data represents a frequency distribution of the depth of recent
earthquakes. Use the frequency distribution to construct a frequency polygon,
Applying a strict interpretation of the requirements for a normal distribution, do
the depths appear to be normally distributed? Why or why not?
Depth (km)
1.00-4.99
5.00-8.99
9.00-12.99
13.00-16.99
17.00-20.99
Frequency
24
13
10
Construct a frequency polygon using the data. Choose the correct graph below.
OA.
O B.
C.
OD.
Frequency
Frequency
25-
Frequency
25-
Frequency
25-
M.
0-
-1.005
Depth (km)
-1.005
Depth (km)
-1.005
Depth (km)
22.995
22.995
Depth (km)
22,995
22.995
-1.005
Applying a strict interpretation of the requirements for a normal distribution, do the depths appear to be normally distrbuted? Why or why not?
O A. The frequency polygon appears to approximate a normal distribution because the frequencies increase to a maximum and then decrease, and the graph
is symmetric.
O B. The frequency polygon appears to approximate a normal distribution because the frequencies continually decrease, and the graph is not symmetnic.
O C. The frequency polygon does not appear to approximate a normal distribution because the frequencies increase to a maximum, then decrease, and the
graph is symmetric.
O D. The frequency polygon does not appear to approximate a normal distribution because the frequencies do not increase to a maximum and then
decrease. and the araph is not svmmetric
O Time Remaining: 02.27.37
Next
Expert Solution
This question has been solved!
Explore an expertly crafted, step-by-step solution for a thorough understanding of key concepts.

This is a popular solution!

Trending now
This is a popular solution!

Step by step
Solved in 2 steps with 1 images

Recommended textbooks for you
Glencoe Algebra 1, Student Edition, 9780079039897…
Algebra
ISBN:
9780079039897
Author:
Carter
Publisher:
McGraw Hill

Algebra: Structure And Method, Book 1
Algebra
ISBN:
9780395977224
Author:
Richard G. Brown, Mary P. Dolciani, Robert H. Sorgenfrey, William L. Cole
Publisher:
McDougal Littell

Elementary Geometry For College Students, 7e
Geometry
ISBN:
9781337614085
Author:
Alexander, Daniel C.; Koeberlein, Geralyn M.
Publisher:
Cengage,
Glencoe Algebra 1, Student Edition, 9780079039897…
Algebra
ISBN:
9780079039897
Author:
Carter
Publisher:
McGraw Hill
Algebra: Structure And Method, Book 1
Algebra
ISBN:
9780395977224
Author:
Richard G. Brown, Mary P. Dolciani, Robert H. Sorgenfrey, William L. Cole
Publisher:
McDougal Littell
Elementary Geometry For College Students, 7e
Geometry
ISBN:
9781337614085
Author:
Alexander, Daniel C.; Koeberlein, Geralyn M.
Publisher:
Cengage,