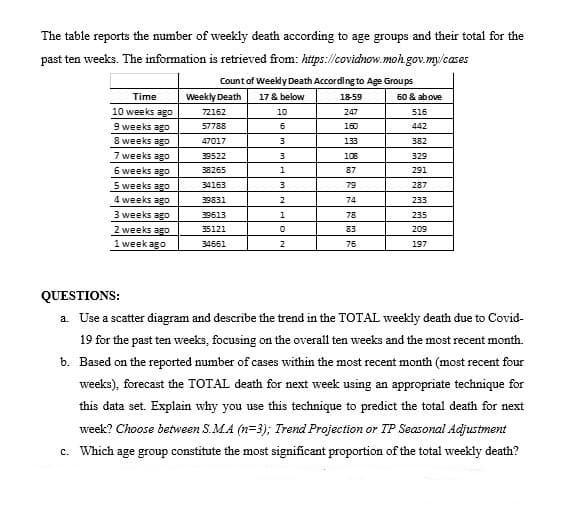
The table reports the number of weekly death according to age groups and their total for the past ten weeks. The information is retrieved from: http://covidhow.moh gov.my/cases Count of Weekly Death According to Age Groups Weekly Death 17 & below Time 10 weeks ago 9 weeks ago 8 weeks ago 7 weeks ago 18-59 60 & above 72162 10 247 516 57788 6 160 442 47017 133 382 39522 108 329 6 weeks ago 5 weeks ago 4 weeks ago 3 weeks ago 2 weeks ago 1 week ago 38265 1 87 291 34163 79 287 39831 2 74 233 39613 1 78 235 35121 83 209 34661 2 76 197 QUESTIONS: a. Use a scatter diagram and describe the trend in the TOTAL weekly death due to Covid- 19 for the past ten weeks, focusing on the overall ten weeks and the most recent month. b. Based on the reported number of cases within the most recent month (most recent four weeks), forecast the TOTAL death for next week using an appropriate technique for this data set. Explain why you use this technique to predict the total death for next week? Choose between S.M.A (n=3); Trend Projection or TP Seasonal Adjustment c. Which age group constitute the most significant proportion of the total weekly death?
The table reports the number of weekly death according to age groups and their total for the past ten weeks. The information is retrieved from: http://covidhow.moh gov.my/cases Count of Weekly Death According to Age Groups Weekly Death 17 & below Time 10 weeks ago 9 weeks ago 8 weeks ago 7 weeks ago 18-59 60 & above 72162 10 247 516 57788 6 160 442 47017 133 382 39522 108 329 6 weeks ago 5 weeks ago 4 weeks ago 3 weeks ago 2 weeks ago 1 week ago 38265 1 87 291 34163 79 287 39831 2 74 233 39613 1 78 235 35121 83 209 34661 2 76 197 QUESTIONS: a. Use a scatter diagram and describe the trend in the TOTAL weekly death due to Covid- 19 for the past ten weeks, focusing on the overall ten weeks and the most recent month. b. Based on the reported number of cases within the most recent month (most recent four weeks), forecast the TOTAL death for next week using an appropriate technique for this data set. Explain why you use this technique to predict the total death for next week? Choose between S.M.A (n=3); Trend Projection or TP Seasonal Adjustment c. Which age group constitute the most significant proportion of the total weekly death?

Glencoe Algebra 1, Student Edition, 9780079039897, 0079039898, 2018
18th Edition
ISBN:9780079039897
Author:Carter
Publisher:Carter
Chapter10: Statistics
Section10.3: Measures Of Spread
Problem 1GP

Related questions
Question
Transcribed Image Text:The table reports the number of weekly death according to age groups and their total for the
past ten weeks. The information is retrieved from: https://covidnow.mohgov.my/cases
Count of Weekly Death According to Age Groups
Time
Weekly Death
17 & below
60 & above
18-59
10 weeks ago
72162
10
247
516
9 weeks ago
8 weeks ago
57788
6
160
442
47017
133
382
7 weeks ago
6 weeks ago
5 weeks ago
4 weeks ago
3 weeks ago
2 weeks ago
1 week ago
39522
3
108
329
38265
1
87
291
34163
79
287
39831
2
74
233
39613
78
235
35121
83
209
34661
2
76
197
QUESTIONS:
a. Use a scatter diagram and describe the trend in the TOTAL weekly death due to Covid-
19 for the past ten weeks, focusing on the overall ten weeks and the most recent month.
b. Based on the reported number of cases within the most recent month (most recent four
weeks), forecast the TOTAL death for next week using an appropriate technique for
this data set. Explain why you use this technique to predict the total death for next
week? Choose between S.M.A (n=3); Trend Projection or TP Seasonal Adjustment
c. Which age group constitute the most significant proportion of the total weekly death?
Expert Solution
This question has been solved!
Explore an expertly crafted, step-by-step solution for a thorough understanding of key concepts.

Step by step
Solved in 4 steps with 4 images

Recommended textbooks for you
Glencoe Algebra 1, Student Edition, 9780079039897…
Algebra
ISBN:
9780079039897
Author:
Carter
Publisher:
McGraw Hill

College Algebra (MindTap Course List)
Algebra
ISBN:
9781305652231
Author:
R. David Gustafson, Jeff Hughes
Publisher:
Cengage Learning

Holt Mcdougal Larson Pre-algebra: Student Edition…
Algebra
ISBN:
9780547587776
Author:
HOLT MCDOUGAL
Publisher:
HOLT MCDOUGAL
Glencoe Algebra 1, Student Edition, 9780079039897…
Algebra
ISBN:
9780079039897
Author:
Carter
Publisher:
McGraw Hill
College Algebra (MindTap Course List)
Algebra
ISBN:
9781305652231
Author:
R. David Gustafson, Jeff Hughes
Publisher:
Cengage Learning
Holt Mcdougal Larson Pre-algebra: Student Edition…
Algebra
ISBN:
9780547587776
Author:
HOLT MCDOUGAL
Publisher:
HOLT MCDOUGAL