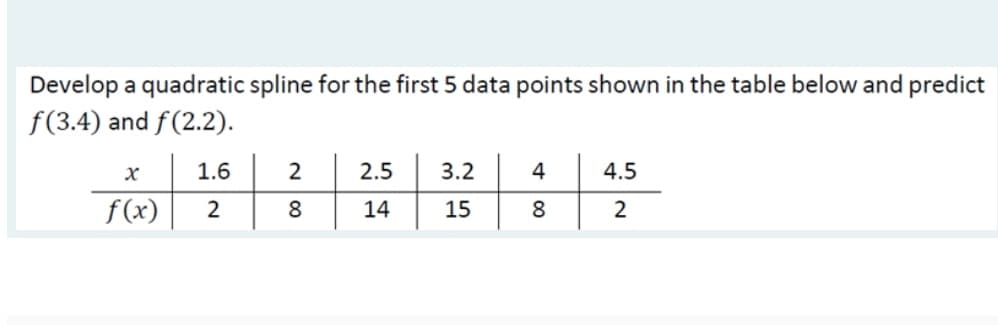
Develop a quadratic spline for the first 5 data points shown in the table below and predict f(3.4) and f(2.2). 1.6 2 2.5 3.2 4 4.5 f (x) 8. 14 15 8 2.


Q: x 0 2 3 5 6 y 1 1 7 11 20 Determine the best (according to sum-of-squares-measure) curve y…
A: The given data is as follows:
Q: Use a graphing calculator or other technology to answer the question. y Which quadratic regression…
A:
Q: The follow table shows total dollar sales (in thousands) for a local retailer for various years.…
A: Consider the given data of the years and the total sales made. Year 2016 2017 2018 2019 2020…
Q: [CLO2] Find least-square-line for the following data points. (1, 1.8) (2, 1.3) (3, 3.5) (4, 5.2) (5,…
A: We will draw the table based on given Points. X y X2 Xy 1 1.8 1 1.8 2 1.3 4 2.6 3 3.5…
Q: The accompanying data was extracted from the article "Effects of Cold and Warm Temperatures on…
A: Hello! As you have posted more than 3 sub parts, we are answering the first 3 sub-parts. In case…
Q: A Zumba instructor remembers the data given in the following table, which shows the recommended…
A: Given Data : X = Age Y = Maximum heart rate 20 170 40 153 60 136 Now for calculating the…
Q: Use the data below to determine the least squares equation using the correct formula. Hint: This is…
A:
Q: Answer #28 - #34 using this data set: f 7 1 6 4 5 3 4 1 3 1 2 1 3 31. What is the mean of X? (SHOW…
A: Given below
Q: 4.Use Lagrang interpolation method to find f(1) based on the following data: a -3 2-1 3 ソ=fx)||1 2 4…
A: 4 Consider the given table x−32−13y=fx1248 Use the Lagrange's interpolation method we will find the…
Q: Use the able of values to find the best possible estimate of g'3.26): Show your work. 9(x) 2.15…
A: Derivative of function at any point gives the value of rate by which function value is changing at…
Q: The data below are the temperatures on randomly chosen days during the summer and the number of…
A: We have used the excel data analysis tool to run the regression analysis.
Q: x0 2 3 5 6 у y 1 1 7 11 20
A: In my calculations the curve is y= a+bx+cx^2 , only change in coefficients. You can do it nomatter…
Q: 3) Assume that you are facing the following set of data. What specification would you use to…
A: Regression analysis, allows you you to infer that there is a relationship between two or more…
Q: Consider the following. quadratic y -2 7 -1 -1.5 -6 1 -6.5 2 -3 3 4.5 16 Find the equation of the…
A:
Q: Regression analysis was applied between sales (v) and advertising (x) across all the branches of a…
A:
Q: (a) Use regression to find a quadratic function that models the data. Choose the correct answer…
A: (a) The variable x is defined as the year, and the variable y is defined as the enrollment. Now…
Q: For the following data points, a) find the linear interpolation spline b) find the quadratic…
A: The data points given is as follows: x -1 0 12 1 52 y 2 1 0 1 0 (a) We are asked to…
Q: For the given data (0, 5), (1,9), (4, 3) find the curve y = a + byx that best fits the data in the…
A: Given the data (0, 5), (1, 9), (4, 3)
Q: O The related coefficient of determination is 0.1 O All of the other answers are true O Only 10% of…
A: We have given that the sample correlation coefficient between X and Y is 0.1
Q: Use a graphing calculator to find a quadratic regression for each data set. Round values to the…
A: The general form of quadratic equation is Ax2 + Bx + C = 0
Q: Examine the following two quantitative variables. Create a quadratic model to predict y using x as…
A: Solution we will solve it by using excel and the steps are Enter the Data into excel Click on Data…
Q: The table lists the cost in millions of dollars for a 30-second commercial for selected years. Year…
A:
Q: Identify a lurking variable for this situation. Find the equation of the least-squares line.…
A:
Q: 2. Please use the following data to calculate f(7) via linear, quadratic, cubic and quartic…
A: As per Bartleby's answering policy, we can answer only one question with a maximum of three…
Q: 15. Use the following table to answer the question below: 3. 4 6. 7 4 6. (a) Is Da function of C?…
A: Given table:- C 3 4 5 6 7 D 2 4 6 4 2 To find:- (a) Is D a function of C? (b) For this…
Q: Q. 1. Fit a straight line trend by least square method from the following data : Value of X : 1 2 3…
A:
Q: The following data is given: x023 5 6 y| 1|1 7 11 20
A:
Q: Q4. By plotting the graph of the given data mention whether there is a positive trend, negative…
A:
Q: . The following data represents the projected global efense spending (in trillion of dollars) from…
A: 9) Given data points are, a) Excel Procedure: Enter t and defense spending in Excel>Data>Data…
Q: Based on the graph below, which of the following statement is correct? 270 225 180 135 -45 M 4 7 70…
A: Please find the solution below. Thank you.
Q: The following data is given: x 0 2 3 5 6 y 1 1 7 11 20 Question 1 Determine the best (according to…
A: Given data, X Y X*Y X*X 0 1 0 0 2 1 2 4 3 7 21 9 5 11 55 25 6 20 120 36
Q: The following data is given: x023 5 6 y| 11 7 11 20
A:
Q: The table below shows the number, in thousands, of vehicles parked in the central business district…
A:
Q: Consider the following data values: 6 11 15 18 f(x) 5 9 10 8 Find the value of f (13.5) using…
A: Given, x 6 11 15 18 f(x) 5 9 10 8
Q: The following simple model is used to determine the annual savings of an individual on the basis of…
A: Given, The following simple model is used to determine the annual savings of an individual on the…
Q: (b) Consider the following data values: 8 11 15 18 f(x) 9 10 8 Find the value of f (12.5) using…
A: To find the value of f12.5: General quadratic spline function is, fx=ax2+bx+c -----(1) Substitute…
Q: Find the quartic function that is the best fit for the data in the following table. - 3 - 2 - 1 1 2…
A: For finding quartic equation, We need atleast five data points.L(x) = Lagrange polynomialL(x) =…
Q: A recent study showed that the hours a person exercised in a week affected the individual'sresting…
A: From the given information r=-0.68 it is the correlation between two variables. So, the percentage…
Q: 8. Find Q.D. and its coefficient from the following data. Class 130- 134 150- 154 155- 160- 164 5…
A:
Q: Q3\Create the FDD table for the given data set. Use it to interpolate of consumption for year…
A:
Q: The data below are the temperatures on randomly chosen days during the summer and the number of…
A: The data inserted in Excel is defined as: In this case, 'Temperature' is the independent…
Q: Test the following data table to see whether the data are quadratic. x 0 4 16 32 44 y 4 12…
A: We have to find the first differences and second differences from the given data.
Q: A fisherman has collected data about the length in inches, L, and weight in ounces, w, of fish he…
A: The linear regression equation is w=−37.1+3.2L Where L is length and w is weight of the fish. We…
Q: 1. By the method of least squares, find the straight line that best fits the following data: I| 2 3…
A:
Q: For the following data points X 1 2 4 y 1 4 a. find the linear interpolation spline b. find the…
A: we have, x0=0, x1=1,x2=2,x3=3,x4=4 and y0=3,y1=1,y2=2,y3=4,y4=2 a Linear Interpolation Spline: The…
Q: a. Does this table support the generalization that larger animals run faster? b. Plot the data…
A:
Q: Fit the following points, (17,8), (18,10), (23,6), (24,5), (27,5), and (32,2). Predict the f(28). A.…
A: Regression equation is used to predict the value of a response variable using the explanatory…
Q: 2. For each table of values, decide whether the data model a linear, quadratic, or exponential…
A:
Q: The following data is given: x02 3 5 6 y|1 1 7 11 20 Question 1 Determine the best (according to…
A:
Q: Î; = 4 + 3X,, +5.5x a. Predict Y for X, = 3. (Type an integer or a decimal.)
A: Y^ = 4+3X+5.5X2
Note: You can use excel to solve the problem and convert it to jpg format


Trending now
This is a popular solution!

Step by step
Solved in 3 steps with 3 images

- A researcher collects data that represents the average number of hours of sleep in the last two nights by 8 depressed patients and 9 non-depressed patients. The researcher is interested in whether the two groups reliably differ in the amount of sleep they get. Use Jamovi to calculate t-obt and the p value.Find the z-score corresponding to a score of X = 45 μ = 40 and σ = 20 μ = 40 and σ =10 μ = 40 and σ = 5 μ = 40 and σ = 2Suppose that the 101 randomly selected eighth-grade students (mentioned in question 6) took a “practice” test similar to the official standardized test a month before the official test was administered. The researchers reported that the (two-tailed) statistical test of the difference between the practice and official test scores resulted in t100 = -2.32, p < .05. (a) Given that the difference score was computed as D = (practice score – official score), do the reported results indicate that students scored significantly higher or lower on the official test relative to the practice test? Explain. (b) If we constructed the corresponding 95% confidence interval for the mean difference (between the practice and official test scores) in the population, would it include zero? Explain.
- An analysis of production rejects resulted in the following figures: (attached) Calculate Karl Pearson’s coefficient of skewness and comment on the results.Find kurtosis by using ungroup data given in the picture using quartile deviation, make sure to arrange data before solving question.At any age, about 20% of American adults participate in fitness activities at least twice a week. However, these activities change as people get older, and occasionally participants cease to be older as they age. In a local survey of n = 100 adults over 40, a total of 15 people indicated that they participated in these activities at least twice a week. Does this data indicate that the percentage of participation for adults over 40 years of age is considerably less than the 20% figure? Find the p-value and use it to draw the appropriate conclusions.