O The related coefficient of determination is 0.1 O All of the other answers are true O Only 10% of the variation of the ice-cream sales is explained by different outdoor temperatures. O c in the linear regression mode Y = b + cX is positive O 90% of the variation of the ice-cream sales is due to the variance of the sales itself.
Q: You are given: (i) 1 for 0Sx <110. 110-x (ii) 8=0.05 Find 19 A20.
A: Given μx=1110-x for 0≤x<110 δ=0.05
Q: O None of the other answers O 0.3174 O 0.1587 O 0.8413 O 0.3413
A:
Q: A data set about speed dating includes "like" ratings of male dates made by the female dates. The…
A: Assume that μ is the population mean “like” ratings of male dates made by the female dates.
Q: When 89 people used the Atkins diet for one year, their mean weight change was 6.4 lb (based on…
A: We have given that, mean weight change (x̄) = 6.4, standard deviation (s) = 6.8 and sample size…
Q: A janitor at a large office building believes that his supply of light bulbs has a defect rate that…
A: We have given that The defect rate p = 0.09 Significance level = 0.01 The null and alternative…
Q: Use the standand normal distribution table to determine the percent of data between z=−0.51 and…
A: Given that : z=−0.51 and z=0.73 By using the standard normal distribution we solve this problem.
Q: Suppose that the average life of a refrigerator before replacement is μ = 15 years with a (68% of…
A: Given that The average life of a refrigerator before replacement is μ = 15 years 68% data range…
Q: toss a die and a coin, if the event A is the occurence of a head and an odd number and the event B…
A:
Q: In a hypothesis test with the null and alternative hypotheses Ho:u 60 and H1:u # 60, a random sample…
A:
Q: An electronics manufacturer wants to estimate the mean lifespan of an electronic component to within…
A:
Q: In a hypothesis test with hypotheses Ho:H = 90 and H1:H # 90, a random sample of 16 elements…
A:
Q: Part 2 of 4 Compute the P-value of the test statistic. Round the answer to at least four decimal…
A: Given that Hypothesized Population Mean (\mu)(μ) = 5050 Population Standard Deviation…
Q: Two methods of measuring surface smoothness are used to evaluate a paper product. The measurements…
A:
Q: Did Clayton State Students gain weight, on average, during the COVID-19 quarantine? You wonder if…
A: Given that x̄ = 168.9 , μ = 163.7 , s = 13.8 , n = 43 Note: According to bartleby experts question…
Q: Ross thinks that the weight of a person can tell you how smart they are. To find out Ross gathered…
A:
Q: In a Pew Research poll, 287 out of 522 randomly selected U.S. men were able to identify Egypt when…
A: Given that X1=287 , X2=233 , n1=522 ,n2=520
Q: The following table lists the monthly incomes (in hundreds of dollars) and the monthly rents paid…
A: Given that X Y X \cdot YX⋅Y X^2X2 Y^2Y2 24 7.0 168 576 49 16 4.5 72 256 20.25 19…
Q: In a simple random sample of size 60, there were 39 individuals in the category of interest. Part:…
A: From the provided information, Sample size (n) = 60 From which 39 individuals in the category of…
Q: The mean age of all 2550 students in a small community college is 22.8 years with a standard…
A: Given that Population size N=2550 Population mean μ =22.8 Population standard deviation =3.2 And…
Q: The time needed to complete a final examination in a particular college course is normally…
A: Given that X~Normal(μ= 80 , σ= 10 ) μ= 80 , σ= 10 Formula for Z-score Z=(X-μ)/σ
Q: 7. Suppose that X follows a geometric distribution, P(X = k) = p(1 –- p)*=1 and assume an i.i.d.…
A: Given that - Suppose that X follows a geometric distribution, P(X= k) = p(1-p)k-1
Q: The IQ of 8 randomly selected senior high students are given below 102,125,120,128,108,124, 115,109…
A: Given values 102,125,120,128,108,124, 115,109 a) Sample mean = (102+125+120+128+108+124+115+109)/8…
Q: Here are the vote tallies from an election. Determine the winner using plurality, runoff, and…
A: Given information: As per guidelines we will solve the first question only, please repost other…
Q: A television show conducted an experiment to study what happens when buttered toast is dropped on…
A: Given that Sample size n =45 Favorable cases x =21 Sample proportion p^=x/n =21/45 =0.4667
Q: A grocery store manager did a study to look at the relationship between the am customers spend in…
A: The independent variable is Time. The dependent variable is Money. We have to do correlation and…
Q: The owner of Showtime Movie Theaters, Inc., used multiple regression analysis to predict gross…
A: a. R2=SSRSST =32.734.9 =0.937 Adj R2=1-1-R2N-1N-p-1, N=sample size and p=number of variables…
Q: Her uiat ue an to vote yes on the new p is a correct interpretation of this p-value? approximately…
A: Solution
Q: Determine whether the samples are independent or matched pairs. The effectiveness of a headache…
A: Here the variables are X1: intensity of a headache before drug treatment and X2: intensity of a…
Q: a adoo m paloud ypea o oo (sunoy u) aun adeuae an Project-1 20 26 Proఆలి 28 Project-3 20 26 19 23 24…
A: Given information: As per guidelines we will solve the first question only, please repost other…
Q: A fast-food chain has set a goal to have the shortest average wait times in their drive-thru line.…
A: We have given that Sample mean = 3.5 Sample standard deviation = 0.75 Sample size = 20 The…
Q: II. Determine whether the events are mutually exclusive, non-mutually exclusive, independent, or…
A:
Q: fixed standard deviation. (a) True (b) False 02. In the Simple linear regression model, Y represents…
A: We have given the following statement about the regression model,
Q: 60% of owned dogs in the United States are spayed or neutered. Round your answers to four decimal…
A: Given that n=44 , p=60% Note: According to bartleby experts question answers guidelines an expert…
Q: Suppose that a manufacturer is testing one of its machines to make sure that the machine is…
A: From the provided information, The hypotheses are as follow: H0: µ = 15 Ha: µ > 15 The p value =…
Q: Let X1, X2, ..X100 be 100 independent observations from a distribution X which is not normally…
A: here given , 100 independent observation selcted from X, X follow normal distribution with mean…
Q: Consider a regression study involving a dependent variable y, a quantitative independent variable…
A: There is one categorical independent variable which has 3 levels. Level 1, level 2 and level 3. So…
Q: How do you determine which data gathering instrument to use in a research?
A: Data collection is an important step in the research process. The instrument you choose to collect…
Q: Test whether increased speed is linked with the claim cost.
A: Regression analysis is useful to test if there exists significant relationship between two…
Q: 1. A machine manufactures high quality pipes. Experience has shown that on average there are three…
A: "Since you have asked multiple questions, we will solve the first question for you. If you want any…
Q: A hotel reservation number consists of five digits followed by two letters followed by three digits…
A: hotel reservation number consists of five digits followed by two letters followed by three digits…
Q: You are conducting a multinomial hypothesis test for the claim that the 4 categories occur with the…
A: Expected frequency= Σfi/n Where fi's are frequencies and n is number of categories. Squared…
Q: A quality control officer was checking the quality of a product on the manufacturing line. For an…
A: Hello! As you have posted 3 different questions, we are answering the first question. In case you…
Q: - Show that P(w) = ,w = 0,1,2,..,1 >0 1+11+1 qualifies as a discrete probability function. 3
A: Condition for discrete probability distribution All probabilities are greater than 0 sum of…
Q: 23.Telephone calls from an office are monitored and found to have a mean duration of 452 s and a…
A: Given,mean(μ)=452standard deviation(σ)=123
Q: A professional employee in a large corporation receives an average of μ = 41.3 e-mails per day. Most…
A: We have given that, Population mean (μ) = 41.3, population standard deviation (σ) = 16.2, sample…
Q: In a CBS News survey done in 2006, 88% of n = 348 randomly sampled married men said that they would…
A: Given that Sample sizes n1=348 , n2=584 Sample proportion p1^=0.88 , p2^=0.84
Q: 4. Suppose that Y1, Y2, ..., Yn constitute a random sample of size n from the density function {(0 –…
A: Since you have posted a question with multiple sub-parts, we will solve first two sub-parts for you.…
Q: Which of the following is the description of Ordinal level. * a. Grading system involving letters…
A: Ordinal level of measurement represents categories which can be ordered. Note : Since you have asked…
Q: 1. A man has 5 different suits, 7 different shirts and 4 different pairs of shoes. In how many ways…
A: here use counting principle
Q: A student took measurements of the mass of an object using the same balance. The data obtained were…
A: Here Given data of mass of objects using the same balance. Data are 1.383 g, 1,387 g, 1.389 g and…
Question 27
In March, Maggie collected the daily sales of ice-cream in Montreal (Y) and the outdoor temperature for each day (X). She computed the sample
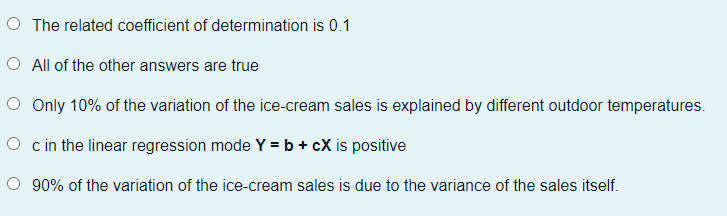
Step by step
Solved in 2 steps
- Find the equation of the regression line for the following data set. x 1 2 3 y 0 3 4For the following exercises, consider this scenario: The profit of a company decreased steadily overa ten-year spam.The following ordered pairs shows dollars and the number of units sold in hundreds and the profit in thousands ofover the ten-year span, (number of units sold, profit) for specific recorded years: (46,600),(48,550),(50,505),(52,540),(54,495). Use linear regression to determine a function Pwhere the profit in thousands of dollars depends onthe number of units sold in hundreds.The following fictitious table shows kryptonite price, in dollar per gram, t years after 2006. t= Years since 2006 0 1 2 3 4 5 6 7 8 9 10 K= Price 56 51 50 55 58 52 45 43 44 48 51 Make a quartic model of these data. Round the regression parameters to two decimal places.
- bThe average rate of change of the linear function f(x)=3x+5 between any two points is ________.Olympic Pole Vault The graph in Figure 7 indicates that in recent years the winning Olympic men’s pole vault height has fallen below the value predicted by the regression line in Example 2. This might have occurred because when the pole vault was a new event there was much room for improvement in vaulters’ performances, whereas now even the best training can produce only incremental advances. Let’s see whether concentrating on more recent results gives a better predictor of future records. (a) Use the data in Table 2 (page 176) to complete the table of winning pole vault heights shown in the margin. (Note that we are using x=0 to correspond to the year 1972, where this restricted data set begins.) (b) Find the regression line for the data in part ‚(a). (c) Plot the data and the regression line on the same axes. Does the regression line seem to provide a good model for the data? (d) What does the regression line predict as the winning pole vault height for the 2012 Olympics? Compare this predicted value to the actual 2012 winning height of 5.97 m, as described on page 177. Has this new regression line provided a better prediction than the line in Example 2?For the following exercises, consider the data in Table 5, which shows the percent of unemployed in a city ofpeople25 years or older who are college graduates is given below, by year. 41. Based on the set of data given in Table 7, calculatethe regression line using a calculator or othertechnology tool, and determine the correlationcoefficient to three decimal places.
- In a statistics course, a linear regression equation was computed to predict the final exam score from the score on the midterm exam. The equation of the least‑squares regression line was ?̂ =10+0.9?,y^=10+0.9x, where ?y represents the final exam score and ?x is the midterm exam score. Suppose Joe scores an 80 on the midterm exam. What would be the predicted value of his score on the final exam?A recent study showed that the hours a person exercised in a week affected the individual'sresting heart rate. It was computed that r = -.68 and the least squares regression line was?̂ = 83-1.4x, where x is the hours exercised and y is the resting heart rate. d. What percentage of variability in resting heart rate can be explained by variability inhours exercised?A recent study showed that the hours a person exercised in a week affected the individual'sresting heart rate. It was computed that r = -.68 and the least squares regression line was?̂ = 83-1.4x, where x is the hours exercised and y is the resting heart rate. c. What does the value -1.4 tell you about the relationship between hours exercisedresting heart rate?
- Suppose the Sherwin-Williams Company has developed the following multiple regression model, with paint sales Y (x 1,000 gallons) as the dependent variable and promotional expenditures A (x $1,000) and selling price P (dollars per gallon) as the independent variables. Y=α+βaA+βpP+ε�=�+���+���+� Now suppose that the estimate of the model produces following results: α=344.585�=344.585, ba=0.106��=0.106, bp=−12.112��=−12.112, sba=0.155�ba=0.155, sbp=4.312�bp=4.312, R2=0.764�2=0.764, and F-statistic=12.593F-statistic=12.593. Note that the sample consists of 10 observations. According to the estimated model, holding all else constant, a $1,000 increase in promotional expenditures sales by approximately gallons. Similarly, a $1 increase in the selling price sales by approximately gallons. Which of the independent variables (if any) appears to be statistically significant (at the 0.05 level) in explaining paint sales? Check all that apply. Selling price (P)…Suppose the Sherwin-Williams Company has developed the following multiple regression model, with paint sales Y (x 1,000 gallons) as the dependent variable and promotional expenditures A (x $1,000) and selling price P (dollars per gallon) as the independent variables. Y=α+βaA+βpP+εY=α+βaA+βpP+ε Now suppose that the estimate of the model produces following results: α=344.585α=344.585, ba=0.102ba=0.102, bp=−11.192bp=−11.192, sba=0.173sba=0.173, sbp=4.487sbp=4.487, R2=0.813R2=0.813, and F-statistic=11.361F-statistic=11.361. Note that the sample consists of 10 observations. 1.)The given F-value shows that you cannot or can reject the null hypothesis that neither one of the independent variables explain a significant (at the 0.05 level) proportion of the variation in income. 2.)Based on the regression model, what is the best estimate of paint sales (x 1,000 gallons) in a sales region where promotional expenditures are $110,000and the selling price is $12.50? a.)213.792…Which of the following statements is true with respect to a simple linear regression model? The percent of variation in the dependent variable that is explained by the regression model is equal to the square of the correlation coefficient between the x and y variables If the correlation coefficient between the x and y variables is negative, the sign on the regression slope coefficient will also be negative If the correlation between the dependent and the independent variable is determined to be significant, the regression model for y given x will also be significant All of the above are true