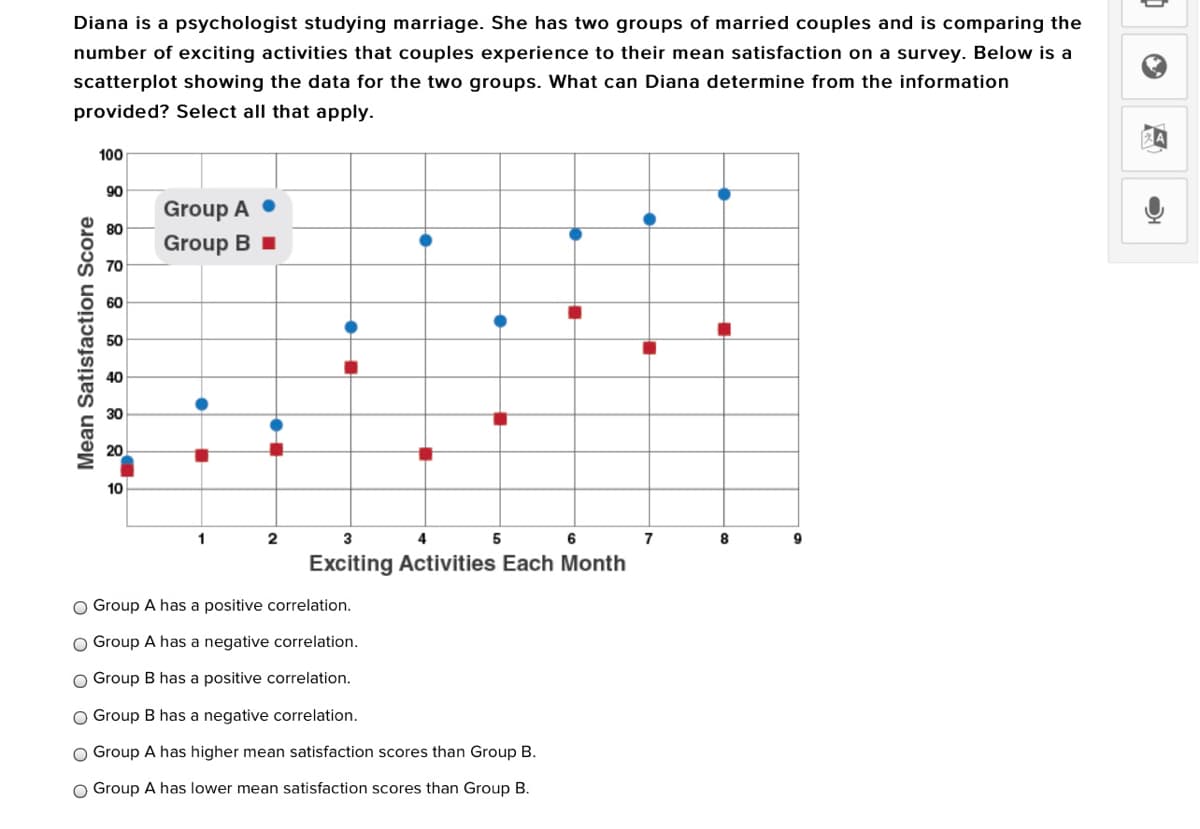
Diana is a psychologist studying marriage. She has two groups of married couples and is comparing the number of exciting activities that couples experience to their mean satisfaction on a survey. Below is a scatterplot showing the data for the two groups. What can Diana determine from the information provided? Select all that apply. 100 90 Group A • 80 Group B I 70 60 50 40 30 20 10 1 2 3 4 5 6 7 8 9 Exciting Activities Each Month O Group A has a positive correlation. O Group A has a negative correlation. O Group B has a positive correlation. O Group B has a negative correlation. O Group A has higher mean satisfaction scores than Group B. O Group A has lower mean satisfaction scores than Group B. Mean Satisfaction Score


Inverse Normal Distribution
The method used for finding the corresponding z-critical value in a normal distribution using the known probability is said to be an inverse normal distribution. The inverse normal distribution is a continuous probability distribution with a family of two parameters.
Mean, Median, Mode
It is a descriptive summary of a data set. It can be defined by using some of the measures. The central tendencies do not provide information regarding individual data from the dataset. However, they give a summary of the data set. The central tendency or measure of central tendency is a central or typical value for a probability distribution.
Z-Scores
A z-score is a unit of measurement used in statistics to describe the position of a raw score in terms of its distance from the mean, measured with reference to standard deviation from the mean. Z-scores are useful in statistics because they allow comparison between two scores that belong to different normal distributions.


Trending now
This is a popular solution!

Step by step
Solved in 2 steps


